research article

Mapping of Quality Index and Pollution Risk along Rosetta Branch using GIS Techniques

Abd El-Gawad HS1, Azzazy MF2*, El-Hattab MM2, Hasseb TZ1

1Central Laboratory for Environmental Quality Monitoring (CLEQM), National Water Research Center (NWRC), El-Kanater, Qalubiya, Cairo, Egypt

2Natural Resources Survey Department, Institute of Environmental Studies and Research, University of Sadat City, Egypt

*Corresponding author: Mohamed Azzazy, Natural Resources Survey Department, Institute of Environmental Studies and Research, University of Sadat City, P.O. Box 13621/6, Egypt. Tel: +202482603208; +202482602178; Email: mohamed.azzazy@esri.usc.edu.eg
Received Date: 05 April, 2018; Accepted Date: 24 April, 2018; Published Date: 04 May, 2018

Citation: Abd El-Gawad HS, Azzazy MF, El-Hattab MM, Hasseb TZ (2018) Mapping of Quality Indexand Pollution Risk along Rosetta Branchusing GIS Techniques. Arch Environ Sci Environ Toxicol: AESET-101. DOI: 10.29011/AESET-101. 10000

The present study focused on assessment surface water quality along Rosetta Branch using Canadian Council of Ministers of the Environment Water Quality Index (CCME-WQI) supported by Egyptian guidelines of law 48/1982 decision 92/2013. Rosetta Branch received most pollutants from two hot spots namely: El-Rahawy drain and industrial activities in Kafr El-Zayat city. The water quality of eight sites-the main surface water resource for Delta Barrage, Edfina Barrage, Rahway, Sable, Tharir, Zawieyt El-bahr, Tala drains outfall and outlet of Rosetta Branch on Mediterranean Sea were investigated. The Geographic Information System (GIS) was used for mapping the WQI variations in different sites. The results of the index average for different sites location at each site showed that the water quality in the studied sites ranked as marginal or fair. This is attributed to the fact of the concentrations of heavy metals, ammonia and organic matter increase in sites that are more affected by drainage water from different drains in the study area. Great efforts are needed, and wastewater must be treated before draining it into the River Nile water.

Introduction
Water pollution was vital threat to human being health and became the most remarkable issue for the sustainable development [1]. Many rivers in the developing countries are heavily polluted due to anthropogenic activities, especially in Egypt due to imbalance between available water resource and increase population, limited fresh water resources, management and lack force regulation application [2].
Rosetta Branch receives polluted waters from different sources including industrial, agricultural and urban sewage that are causing serious environmental impacts on its freshwater [3]. It is affected by the agricultural drains (EL-Rahawy, Sabal, El Tahrir, Zaweit El-Bahr and Tala) located along the branch and by the industrial companies at Kafr El-Zayat city [4].
Water quality evaluation is considered as critical issue in recent years, especially when freshwater is becoming a scarce resource in the future; the world-widely used principal methods for water quality assessment include water quality index, Water Quality Identification (WQI) [5-7]. Water quality assessment at Rosetta Branch requires not only a large number of variable and corresponding evaluation factors, but also a spatial distribution of pollution levels based on every variable and evaluation factor. Many studies used WQI the index to monitor the water quality, assess water quality in irrigation and drainage canals in Upper Egypt, study the suitability of the Nile River water for various uses and apply this index at drinking water abstraction in El-Nubaria Canal [8-11].
GIS, as the most powerful tool for handling spatial data, performing spatial analysis and manipulating spatial outputs, becomes a unique tool for geo-statistical analysis and spatial interpolation utilizing measured samples with known values to estimate unknown values so as to visualize the pollution spatial patterns [12,13]. GIS and modeling have been specifically used in risk assessment and environmental pollution studies at a watershed scale [14-17]. Aiming at evaluating water quality and identifying the potential polluted risky zones with GIS approach, this paper deals with the site observation data of water quality collected from the field conducted with analyses during two seasons 2015 in Rosetta Branch watershed.
Materials and Methods
Rosetta Branch represents the main freshwater stream that extends northwards for about 236 km on the western boundary of the Nile Delta from Egypt's Delta Barrage. Rosetta branch has an average width of 180 m and depth from 2 to 4 m. The estuary is delimited by a barrage for controlling water discharge at Edfina City, 30 km upstream the sea.
Environmental Problem
With rapid economic development in late 1959s, Rosetta Branch began to experience increased pollution, especially in recent years the surface water of the drainage is polluted dramatically. The contaminants come mainly from domestic sewage, industrial wastewater, agriculture fertilizers, pesticides and human activity productions. The main pollution of the Rosetta Branch watershed is human activities non-point source pollution. Enough evidences show that over the last 20 years, water quality in the Rosetta Branch watershed has deteriorated significantly. Rosetta Branch receives more than 3 million cubic meters daily of untreated or partially treated domestic and industrial wastes in addition to agricultural drainage water. Many studies focused on the discovery of the relationship between biological, chemical data and in situ measurements. However, this study was expanded to select laboratory parameters that are less likely affecting the radiation reflectance nevertheless still correlated to water quality.
Description of Study Area
Rosetta Nile Branch receives relatively high concentrations of organic compounds, nutrients and oil & grease. This study focused on the area started River Nile - Delta Barrage upstream Rosetta branch toward the downstream of River Nile - Edfina Barrage about 30 km where the most pollution hot spots show its influence on the branch. The selected sampling sites were lay at the western and eastern parts of the Rosetta branch where water locations stared from Delta Barrage - reference point of Rosetta branch (D1), Outlet of Rahway drain (D2) western Rosetta branch, Outlet of Sable drain eastern Rosetta branch (D3), Outlet of Tharir drain western Rosetta branch (D4), Outlet of Zawieyt El-bahr western Rosetta branch (D5), Outlet of Tala drain eastern Rosetta branch (D6), Edfina Barrage (D7), and outlet of Rosetta Branch on Mediterranean Sea (D8).
In total, 8 sites were defined during different pollution sources during summer season and the worst conditions - winter season along study Rosetta branch (Table 1) and (Figure 1).
Sampling Program
In order to ensure enough spatial water sampling representative in such a large watershed while decreasing the pressure of logistic support in the field to the minimum, the sampling strategy was designed to account for enough impacts being posed from the main tributary inputs upon downstream water quality by subdivided the watershed drainage area into 8 equal grids according to geographic location with GIS tool. The sampling activity was conducted following technical specification requirements for monitoring of surface water and waste water in summer season and the worst conditions - winter season along study Rosetta branch. Sampling was carried out according to standard methods for examination of water and wastes (APHA, 2012). Three water samples from each sampling site were taken and analyzed for physical and chemical analyses. Water samples from each site were collected in various containers according to the parameters need to be measured.
Experiment Work
Water sample analyses were carried out according to standard methods for examination of water and wastes (APHA, 2012). A number of water quality variables were measured at field during sampling; however, the rest of water quality variables were analyzed at the Central Laboratory for Environmental Quality Monitoring (CLEQM). Field parameters (pH, Electric Conductivity (E.C) and Dissolved Oxygen (D.O) were measured in-situ using the multi-probe system, model Hydra Lab-Surveyor and rechecked in laboratory using the following bench-top equipment to ensure data accuracy. The established and analyzed the combined remote sensing and WQI methods were to retrieve water quality focusing on forty variables as shown in Table 2. All the observed data was facilitated and visualized to perform spatial analysis with GIS software and achieved for further studies.
The Coordinates of sampling locations were measured using a hand-held Global Positioning System (GPS). The maps show the state and district boundaries were downloaded and converted into tiff format. By creating a folder connected to the Arc-Catalogue, different shape files were created to represent varying features like state and district boundaries, River Nile, drains and sampling points. The boundaries of state and district were geo-referenced using Arc-GIS software and the locations were marked on map of Rosetta branch. The distance between sampling locations were measured using different GIS tools. Thematic layers of the major stress parameters were prepared in terms of water quality index at each sampling location. The water quality parameters at all the locations were listed according to Egyptian environmental Law Guidelines of 48/1982 - Decision 92/2013 2013 as shown in Table 2.
Geographic Information System (GIS)
GIS technology was confirmed to be very useful on establishing a time cost effective method for the routine monitoring of different water body. The study provided all information about the environmental status of the pollution along Rosetta Branch using analytical data and GIS. Coordinates that are Longitude (North), Latitude (East) and Mercator coordinates are described in Table 3. Therefore, the necessity of these water samples for the classification process highly depends on the accuracy of the fieldwork and laboratory analysis.
ArcGIS 10.0 software was used in creating the Water Quality Index (WQI) for storage, retrieval, data analysis and mapping. The WQI is collection of database of hydrological, water quality indicators and images that were remotely sensed using Arc Catalog in ArcGIS 10.0. GIS database are often large and complex collections of geographic shape files features with their corresponding attribute tables.
In this study GIS database is developed to illustrate the water quality for specified sites location at eight sites in Rosetta branch. Base map is created by added layers of polyline shape files for studying eight sites on Arc Map to help in identifying the sites location on these studied locations.
Actual collected data such coordinates for each site location by using GPS system has been created on the map as a point shape file by using Arc Catalog. This point shape file is added as a sites location layer on the base map. In the attribute table of the sites location layer, CCME-WQI values and rank is added in two fields. Then according to categories classification for the values and rank of the index the WQI map was created.
Water Quality Assessment Method
The National Water Research Center (NWRC) within MWRI is charged of water quality monitoring for the purpose of fulfilling MWRI’s responsibility in providing water of suitable quality to all users. NWRC maintains a national monitoring network, testing laboratory and database for conducting its responsibilities related to water quality management. Central Laboratory for Environmental Quality Monitoring plays key roles in NWRCs efforts that monitor more than 20 points along Rosetta Branch.
The Canadian Council of Ministries of the Environment (CCME) Water Quality Index (WQI) facilitates the evaluation of surface water quality for protection of aquatic life with specific guidelines. Calculations of the index are based on Scope (F1); frequency (F2) and the amplitude (F3). Sampling protocol requires at least four parameters, sampled at least four times and no maximum parameters has been set. The resultant index can be referred to a standard table which constitutes numerical values ranging between 0 and 100 with a rating of excellent, good, fair, marginal and poor. Several authors applied this index. The data represented in this paper for Canadian Council of Ministers of the Environment Water Quality Index (CCME-WQI) calculation was collected on summer and winter month's basis, along one year (2015).
The 14 water quality parameters used in CCME-WQI calculation are Biochemical Oxygen Demand (BOD), Chemical Oxygen Demand (COD), Nitrate (NO3), Ammonia (NH4), Cadmium (Cd), Copper (Cu), Iron (Fe), Manganese (Mn), Zinc (Zn), Lead (Pb), Nickel (Ni), the power of hydrogen (pH), Total Dissolved Solid (TDS) and Dissolved Oxygen (DO). The water quality parameters data for investigated locations, eight sites were obtained to assess water quality and determine WQI.
Water Quality Index (CCME-WQI)
The guidelines of factors used in the WQI calculations are presented in Table 2. These guidelines are according to Egyptian Ministry of Water Resources and irrigation “law 48/1982”, for protection of the Nile River and Waterways from Pollution (decree No. 49 in the amended executive regulations of the law by Minister Decision No. 92/2013).
The WQI is an attempt to represent overall quality of water collected from water body. It is considered a tool for simplifying the reporting of water quality data. WQI numerically summarizes the information from multiple water quality parameters into a single value. The single value can be used to compare data from several sites. On the other hand, WQI is defined as rating reflecting the composite effects of a number of parameters on the overall water quality. The CCME-WQI, (CCME, 2001) was used in the calculation after the following equation:


Depending upon the water quality index, the quality of the water is ranked by relating it to one of the following categories as in Table 4.

Results and Discussion
The data is average value of three replications at each site. Figures (1-2) are water quality index based on chemical variables that were during winter and summer seasons 2015. The data were compared with Egyptian Environmental Law 48-Decision 92/2013 limits. Water quality of Rosetta Branch was investigated using CCME index that was applied to eight monitoring points in the aquatic bodies. Concentrations of 14 variables were normalized on a scale from 0 to 100 and translated into statements of water quality (excellent, good, regular, fair, and poor).
The result revealed that the overall water quality in Delta Barrage was good and excellent level during winter and summer seasons, respectively. Edfina Barrage declined to fair water quality category in investigation periods as shown in Figure 1 as result of aquacultures fish ponds. While other locations deteriorated from marginal (45-64) to fair (65-79) water quality levels in summer season and from poor (0-44) to fair (65-79) water quality levels in winter season as shown in Figure 1. The water quality levels varied according to the specific effect of the pollutants to the index calculation
The result of investigation showed that NH+4-N and BOD played the main roles in WQI calculations. They were a useful and easily applicable methodology in the assessment of the impacts of human activities effluents on water quality of Rosetta Branch stream. The variation is considered according sometimes to NO3, SO4, DO, TDS, and some heavy metals. The average Water Quality Index (WQI) in each location was calculated. Table 5 showed the spatial variations of WQI for the different studying locations. It is noticed that the WQI varies from each location to the other due to the changes in drainage water quality and quantity that are discharged into Rosetta Branch. Furthermore, the poor and marginal ranks for WQI at location (WQI-2), outlet Rahway drain indicated a serious treatment must be applied for sewage wastewater as shown in Figure 1.
The study investigated water quality index for Rosetta Branch River Nile in 2015 using water quality variables as predictors. Water quality index were used to evaluate the pollution status in the investigated locations by employing GIS software (ArcGIS 10.0) for data processing, estimations, and evaluations.
The WQI map is visualized by using GIS software to illustrated locations classification based on the WQI values and the rating in the attributed table to show the spatial variation for each location at the studied area as shown in Figure 2. It was Obvious that, WQI of all sites except Delta Barrage ranked as marginal or fair level. This means that their water quality is frequently threatened or impaired; conditions often depart from natural or desirable levels. These conditions illustrated the negative effect of drainage water on Western Delta Canals (Agrama and El-Sayed, 2013) as well as the agricultural activities in the studied Regions.
The results displayed that the reduction in the WQI levels along Rosetta Branch in worst conditions in winter season due to the increase in the organic matters as illustrated in parameters of organic pollution indicators DO, BOD and COD. This indicated the presence of domestic pollution as well as the deterioration in WQI levels is attributed also to the presence of nutrients NO3, N-NH+4, and TDS where these pollutants are attributed to agricultural activities. In addition, the presence of heavy metals (Cu, Fe, Mn, Zn, Cd) in the water pointed out that the industrial activates affected this water and appears in this area of study. So, the surface water quality in Rosetta Branch must be monitoring to manage and control water quality in a good manner.
Conclusion and Recommendations
The accumulation of agricultural drainage, domestic and sewage wastewater were supplying the deterioration of studying locations that flow directly to Rosetta Branch. CCME-WQI calculations were done on monthly basis along summer and the worst conditions of 2015. The water quality classified as mainly marginal or fair quality level at almost locations except Delta Barrage classified as mainly good or excellent level. The generated results made a good contribution in the view of the official use of water before Rosetta Branch water. Water quality in the studying sites is considered as marginal; water quality is frequently threatened or impaired; conditions often depart from natural or desirable levels. While Water quality in the studying sites is considered as fair; water quality is usually protected but occasionally threatened or impaired; conditions often depart from natural or desirable levels.
The results of this study might assist the decision makers in the pollution control along Rosetta Branch where the CCME-WQI gives an effective over view about the study area which is required intensified monitoring activities. As a result, it was recommended that improvement utilizations of water along Rosetta Branch should be restricted according to its quality.

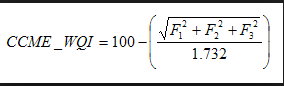
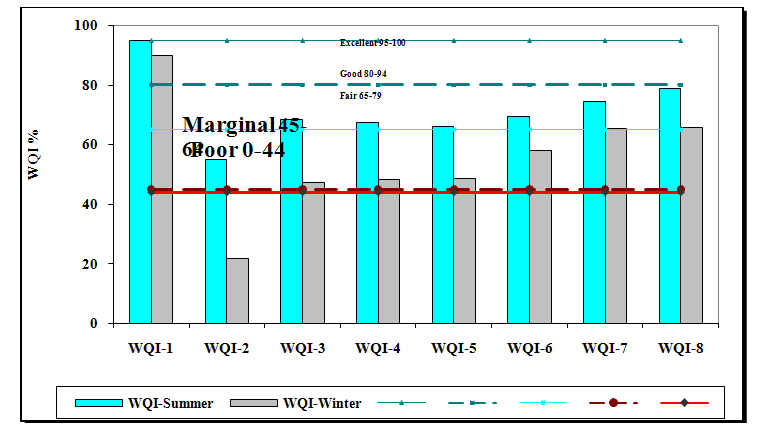
Figure 1: Values of WQI for eight locations along Rosetta branch 2015.

No.

Site Code

Description of Locations

1

WQI-1

Rosetta Branch - Delta Barrage - Reference Point

2

WQI-2

Outlet of Rahway drain western Rosetta branch

3

WQI-3

Rosetta Branch - outlet of Sable drain eastern Rosetta branch

4

WQI-4

Outlet of Tharir drain western Rosetta branch

5

WQI-5

Outlet of Zawieyt El-bahr drain western Rosetta branch

6

WQI-6

Outlet of Tala drain eastern Rosetta branch

7

WQI-7

Rosetta Branch - Edfina Barrage

8

WQI-8

Outlet of Rosetta Branch on Mediterranean Sea


Table 1: Description for Sites Location along Rosetta Branch.


No.

Parameters

Guidelines

1

pH

6.5-8.5

2

DO-mg/l

6

3

TDS-mg/l

500

4

NH4-mg/l

0.5

5

NO3-mg/l

2

6

BOD-mg/l

6

7

COD-mg/l

10

8

Cd-mg/l

0.001

9

Cu-mg/l

0.01

10

Fe-mg/l

0.5

11

Mn-mg/l

0.2

12

Zn-mg/l

0.01

13

Pb-mg/l

0.01

14

Ni-mg/l

0.02


Table 2: Water quality variables and their Egyptian environmental guidelines.


No.

Code

Longitude (North)

Latitude (East)

Eastward-X (m)

North-Y (m)

1

D1

30°

5"

11'

1"

7'

31°

3340716.57

318697.48

2

D2

30°

24"

12'

00"

2'

31°

3343317.78

310703.06

3

D3

30°

8"

32'

6"

51'

30°

3380092.48

293908.76

4

D4

30°

24"

36'

48"

47'

30°

3388053.38

288790.48

5

D5

30°

50"

42'

39"

45'

30°

339999.40

285596.51

6

D6

30°

1"

49'

48"

48'

30°

3411524.41

286691.87

7

D7

31°

20"

18'

9"

31'

30°

3466123.48

263900.76

8

D8

31°

48"

27'

3"

22'

30°

3483961.92

249857.69


Table 3: Geographic and Mercator coordinates of sampling sites in Rosetta branch.


CCME-WQI Value

Score

Remarks

95 - 100

Excellent

Water quality is protected with a virtual absence of threat or impairment; conditions very close to natural or pristine levels

80 - 94

Good

Water quality is protected with only a minor degree of threat or impairment; conditions rarely depart from natural or desirable levels

65 - 79

Fair

Water quality is usually protected but occasionally threatened or impaired; conditions sometimes depart from natural or desirable levels

45 - 64

Marginal

Water quality is frequently threatened or impaired; conditions often depart from natural or desirable levels

0.0 - 44

Poor

Water quality is almost always threatened or impaired; conditions usually depart from natural or desirable levels


Table 4: CCME-WQI categories.


Site Code

WQI-Summer

Rating

WQI-Winter

Rating

WQI-1

95.11

excellent

89.81

good

WQI-2

54..91

marginal

21.86

poor

WQI-3

68..51

fair

47.44

marginal

WQI-4

67..52

fair

48.47

marginal

WQI-5

66.21

fair

48.69

marginal

WQI-6

69.43

fair

58.12

marginal

WQI-7

74.56

fair

65.45

fair

WQI-8

78.74

fair

65.93

fair


Table 5: Values of WQI for 2015 seasons.

  1. Chang-An Yan, Wanchang Zhang, Zhijie Zhang, Yuanmin Liu, Cai Deng, et al. (2015) Assessment of water quality and identification of polluted risky regions based on field observations & GIS in the Honghe river watershed, China. PLoS One: 10.
  2. Jonnalagadda SB, Mhere G (2001) Water quality of the Odzi River in the eastern highlands of Zimbabwe. Water Rese 35: 2371-2376.
  3. Elewa AA, Shehata MB, Mohamed LF, Badr MH, Abdel-Aziz GS (2009) Water quality characteristics of the River Nile at delta barrage with special reference to Rosetta Branch. Global J Environ Res 3: 1-6.
  4. Donia N (2005) Rosetta branch waste load allocation model. 9th International Water Technology Conference, IWTC9, Sharm El-Sheikh, pp. 277-288.
  5. Varol M, Gökot B, Bekleyen A,Sen B (2011) Water quality assessment and apportionment of pollution sources of Tigris River (Tukey) using, multivariate statistical techniques-A case study. River Res App l28: 1428-1438.
  6. Xu ZX (2005) Comprehensive water quality identification index for environmental quality assessment of surface water. J Nat Sci 33: 482-488.
  7. Shankar BS, Sanjeev L (2008) Assessment of water quality index for the groundwaters of an industrial area in Bangalore, India. Environ Eng Sci: 25.
  8. Lumb A, Halliwell D, Sharma T (2006) Application of CCME water quality index to monitor water quality: A case of the Mackenzie River Basin, Canada. Environ Monit Assess 113: 411-429.
  9. Radwan M,El-Sadek A (2008) Water quality assessment of irrigation and drainage canals in upper Egypt. Twelfth International Conference on Water Technology, IWTC12, Alexandria, Egypt 1239-1251.
  10. Ali Khan A, Khan H, Abdel-Gawad S (2008) A real time water quality monitoring network and water quality indices for River Nile. 13th IWRA World Water Congress, Montpellier, France.
  11. Donia N, Farag H (2010) A waste load model analysis for El Noubariya Canal drinking water abstraction, Egypt. 14th International Conference on Water Technology, IWTC 14, Cairo, Egypt, 675-690.
  12. Vairavamoorthy K, Yan J, Galgale HM,Gorantiwar SD (2007) IRA-WDS: A GIS-based risk analysis tool for water distribution systems. Environ Model Software 22: 951-965.
  13. Facchinelli A, Sacchi E, Mallen L (2001) Multivariate statistic a land GIS-based approach to identify heavy metal sources in soils. Environ Pollut 114: 313-324.
  14. Wan W, Wang S (2013) Areal (2-D) simulation of water flood process in unit well pattern. Int J Chem Petrol Sci 2: 1-10.
  15. Jiang W, Cai Q, Xu W, Yang M, Cai Y, et al. (2014) Cr (VI) adsorption and reduction by humic acid coated on magnetite. Environ Sci Technol 48: 8078-8085.
  16. Gong X (2014) Facile formation of nanoparticle patterns by water induced flow of a polymer thin film. Res Adv 4: 54494-54499.
  17. Jasmin I, Mallikarjuna P (2014) Physicochemical quality evaluation of groundwater and development of drinking water quality index for Araniar River Basin, Tamil Nadu, India. Environ Monit Assess 186: 935-948.

© by the Authors & Gavin Publishers. This is an Open Access Journal Article Published Under Attribution-Share Alike CC BY-SA: Creative Commons Attribution-Share Alike 4.0 International License. With this license, readers can share, distribute, download, even commercially, as long as the original source is properly cited. Read More.

Archives of Environmental Sciences and Environmental Toxicology

slot deposit danatips ampuh bermain slot mahjong waystrik slot sugar rushakun pro mahjong gacorrtp slot terjituslot mahjong ways gacorcara dapetin maxwin olympuspancing scatter mahjong ways 1rekomendasi slot mahjong ways 2scatter mahjong terbarupola mahjong ways hari inimahjong ways modal recehcuan mahjong waysdemo slot pg softnaga awal julyrtp slot awal julymahjong bulan mudamodal receh slotlink slot mahjongwinrate tinggi rtpslot server filipinavolatility pg softwaktu tepat slot gacorjam gacor saldo bancarfitur bonus lucky neko4 simulasi jackpot mahjongtrik sepuh mantan napicara menggunakan pola slot mahjongrtp tertinggi hari inislot mahjong ways 1pola gacor olympus hari inipola gacor starlight princessslot mahjong ways 2strategi olympustrik mahjong ways 2trik olympus hari inirtp koi gatertp pragmatic tertinggicheat jackpot mahjongpg soft link gamertp jackpotelemen sakti mahjongpola maxwin mahjongslot olympus mudah mainrtp live starlightrumus slot mahjongmahjong scatter hitamslot pragmaticjam gacor mahjongpola gacor mahjongstrategi maxwin olympusslot jamin menangrtp slot gacorscatter wild banditoamantotorm1131