 review article
 Potential Biomarkers in Drug-Resistant Colorectal Cancer Cells
Dangran Li 1,2 , Lan Jin 1 , Mingge Wang 1 , Jinghua Chen 1* , Chunwei Xia 3* , Chen Chen 1*
1 Key Laboratory of Carbohydrate Chemistry and Biotechnology, Ministry of Education, School of Life Sciences and Health Engineering, Jiangnan University, Wuxi 214122, China
2 The State Key Laboratory of Pharmaceutical Biotechnology, College of Life Sciences, Nanjing University, Nanjing, 210029, China
3 Department of Respiratory Medicine, Affiliated Nanjing Brain Hospital, Nanjing Medical University, Nanjing, China
*Corresponding author: Chen Chen, Key Laboratory of Carbohydrate Chemistry and Biotechnology, Ministry of Education, School of Life Sciences and Health Engineering, Jiangnan University, Wuxi 214122, China
*Co-coresponding authors: Chunwei Xia, Department of Respiratory Medicine, Affiliated Nanjing Brain Hospital, Nanjing Medical University, Nanjing, China;
Jinghua Chen, Key Laboratory of Carbohydrate Chemistry and Biotechnology, Ministry of Education, School of Life Sciences and Health Engineering, Jiangnan University, Wuxi 214122, China.
Received Date: 09 December, 2022
Accepted Date: 15 December, 2022
Published Date: 19 December, 2022
Citation: Li D, Jin L, Wang M, Chen J, Xia C, et al. (2022) Potential Biomarkers in Drug-Resistant Colorectal Cancer Cells. Ann med clin Oncol 5: 142. DOI: https://doi.org/10.29011/2833-3497.000142
Abstract
Colorectal cancer contributed to the second cause of cancer-related death. Targeted therapy and chemotherapy seem not to reach the optimized response to the patients. More drug targets need to be identified. We screened 352 differentially expressed genes (DEGs) from three GEO datasets which contained MEK and CDK inhibitors as well as natural compounds that mediated drug resistance. STRING and Cytoscape databases plus GO annotation and KEGG pathway analysis narrowed 352 DEGs down to 4 candidate hub genes: VEGFA, IGF1R, FOS, and MDM2. The clinical significance of these 4 DEGs had been evaluated by overall survival rate using TCGA human patients’ samples and protein staining using immunohistochemistry provided by the Human Protein Atlas (HPA) website. Our identified DEGs may serve as biomarkers for patients’ prognosis or help reduce chemoresistance when combining those DEGs inhibitors with current clinical treatments.
Introduction
Colorectal Cancer (CRC) ranks the second highest mortality with an increasing incidence yearly [1]. Therapies for localized CRC generally include surgical resection, adjuvant chemotherapy (first-line therapy 5-FU and oxaliplatin), biomarkers (such as CDK and MEK, etc.) -driven targeted therapy, and immunotherapy (PD1/PD-L1) corresponding to Tumor-Node-Metastasis (TNM) stage [2]. Although the targeted therapy seems to have a good response, the recurrence rate succumbs to the primary and the acquired resistance [3]. CDK and MEK1/2 inhibitors as well as natural products played an important role to suppress tumor growth in the preclinical phase. For example, firstly, CDK inhibitors, impairing the CDK enzyme activity, displayed anti-tumor efficacy by arresting the cell cycle and inhibiting cell proliferation [4]. R547 is a pan-CDK inhibitor under development, which had tumor toxicity in small cell lung cancer [5] and hepatocellular carcinoma [6]. However, the mechanism of R547 in CRC is still unclear. Secondly, AZD6244 (selumetinib), a selective MEK1/2 inhibitor, was first approved for the treatment of neurofibromatosis and various cancers [7]. However, continuous use of AZD6244 accumulated acquired drug resistance in various cancers [8,9]. And AZD6244 mediated resistance in CRC is still unknown. Thirdly, natural products recently gained attention as anti-tumor drugs in preclinical trials due to relatively low toxicity [10]. It is noteworthy that rosemary extract could improve treatment response in cancer cells resistant to chemotherapy [11,12]. Therefore, clarifying molecules induced by rosemary extract is beneficial for understanding the mechanism of acquired resistance. Overall, different classifications of CRCs consisting of more than one drug target is still a therapeutic challenge [13], given that many biomarkers identified to predict patients’ response in the clinical setting, such as KRAS [14], Microsatellite Instability (MSI)[15], and Deficient Mismatch Repair (dMMR) [16], etc. Therefore, it is urgent to discover novel biomarkers for prognostication and treatments.
In this study, we screened multiple molecules related to the resistance of CDK inhibitors, MEK inhibitors, and of carnosic acid extracted from rosemary. Next, we enriched these molecules in the STRING database to acquire hub genes with Cytoscape software. With the aid of GO annotation and the KEGG pathway analysis of the most significant hub genes, candidate genes were mainly involved in the top 5 significant pathways related to drug resistance. We investigated the mutated frequency of 4 candidate genes in CRC subtypes of patients to verify their feasibility to become potential biomarkers based on evaluating the patient’s response and prognosis. Moreover, the clinical relevance had been assessed by the overall survival rate of CRC patients and the protein expression of 4 candidate genes: VEGFA, IGF1R, FOS, and MDM2. In summary, the 4 most significant genes might be the potential diagnostic biomarkers and drug targets, enhancing drug resistance in CRC cells.
Methods
GEO Data Mining
Three GEO datasets (GSE15395 [17], GSE55624 [18], and GSE56496 [19]) were downloaded from the Gene Expression Omnibus (GEO) database ( https://www.ncbi.nlm.nih.gov/ gds ) . The first two datasets shared the same GPL570 platforms, Affymetrix Human Genome U133-Plus 2.0 Array. GSE56496 dataset was based on the GPL6480 platform, Agilent-014850 whole human Genome Microarray 4x44K G4112F. |logFC (fold change)|>2 and P value < 0.01 were considered as the cut-off criteria to identify more significant differentially expressed genes (DEGs) in each GEO dataset. Selected DEGs were overlapped by the Venn diagram.
Protein-Protein Interaction Network (PPI)
The overlapping genes generated from the Venn diagram were imported into the STRING website ( https://string-db.org/) and the networks of interactive molecules were presented by Cytoscape software. The cytoHubba and MCODE plugins had been applied to generate the hub-gene networks.
GO Function and KEGG Pathway Enrichment Analysis
In brief, we imported the 352 overlapping genes gained from 3 GEO datasets described above into the Database for Annotation, Visualization, and Integrated Discovery (DAVID) online tool ( https://david.ncifcrf.gov/) to analyze Gene Ontology (GO), including molecular function (MF), cellular component (CC) and biological process (BP), and Kyoto Encyclopedia of Genes and Genomes (KEGG) pathway enrichment. P value < 0.05 is considered the statistical significance for the GO enrichment and KEGG pathway, displayed by the bar graph (Tables 1-4).
|
Term |
Count |
P Value |
|
hsa04151: PI3K-Akt signaling pathway |
22 |
6.11E-06 |
|
hsa04066: HIF-1 signaling pathway |
10 |
1.41E-04 |
|
hsa04015: Rap1 signaling pathway |
14 |
3.48E-04 |
|
hsa04261: Adrenergic signaling in cardiomyocytes |
11 |
5.03E-04 |
|
hsa04510: Focal adhesion |
13 |
1.01E-03 |
|
hsa05200: Pathways in cancer |
19 |
1.04E-03 |
|
hsa04970: Salivary secretion |
7 |
8.18E-03 |
|
hsa04540: Gap junction |
7 |
9.12E-03 |
|
hsa05152: Tuberculosis |
10 |
1.03E-02 |
|
hsa04912: GnRH signaling pathway |
7 |
1.07E-02 |
|
hsa04022: cGMP-PKG signaling pathway |
9 |
1.56E-02 |
|
hsa04915: Estrogen signaling pathway |
7 |
1.57E-02 |
|
hsa04068: FoxO signaling pathway |
8 |
1.99E-02 |
|
hsa05145: Toxoplasmosis |
7 |
2.51E-02 |
|
hsa04725: Cholinergic synapse |
7 |
2.61E-02 |
|
hsa04923: Regulation of lipolysis in adipocytes |
5 |
2.73E-02 |
|
hsa05206: MicroRNAs in cancer |
12 |
3.24E-02 |
|
hsa05215: Prostate cancer |
6 |
3.40E-02 |
|
hsa04921: Oxytocin signaling pathway |
8 |
3.41E-02 |
|
hsa04010: MAPK signaling pathway |
11 |
3.45E-02 |
|
hsa04924: Renin secretion |
5 |
4.17E-02 |
|
hsa04713: Circadian entrainment |
6 |
4.50E-02 |
|
hsa05211: Renal cell carcinoma |
5 |
4.59E-02 |
Table 1: KEGG pathway.
|
Term |
Count |
P Value |
|
GO:0008284~positive regulation of cell proliferation |
25 |
5.99E-06 |
|
GO:0010761~fibroblast migration |
5 |
2.16E-05 |
|
GO:0000122~negative regulation of transcription from RNA polymerase II promoter |
29 |
1.62E-04 |
|
GO:0045944~positive regulation of transcription from RNA polymerase II promoter |
33 |
1.21E-03 |
|
GO:0014065~phosphatidylinositol 3-kinase signaling |
5 |
1.41E-03 |
|
GO:0030336~negative regulation of cell migration |
8 |
1.85E-03 |
|
GO:0043547~positive regulation of GTPase activity |
22 |
1.87E-03 |
|
GO:0048009~insulin-like growth factor receptor signaling pathway |
4 |
1.93E-03 |
|
GO:0030334~regulation of cell migration |
7 |
2.40E-03 |
|
GO:0001701~in utero embryonic development |
11 |
2.49E-03 |
|
GO:0006417~regulation of translation |
6 |
2.62E-03 |
|
GO:0034097~response to cytokine |
6 |
2.62E-03 |
|
GO:0030324~lung development |
7 |
2.75E-03 |
|
GO:0007010~cytoskeleton organization |
10 |
3.00E-03 |
|
GO:0045893~positive regulation of transcription, DNA-templated |
20 |
3.32E-03 |
|
GO:0010507~negative regulation of autophagy |
5 |
4.17E-03 |
|
GO:0009409~response to cold |
5 |
4.17E-03 |
|
GO:0045892~negative regulation of transcription, DNA-templated |
19 |
5.21E-03 |
|
GO:0014894~response to denervation involved in regulation of muscle adaptation |
3 |
6.67E-03 |
|
GO:0009887~organ morphogenesis |
7 |
7.03E-03 |
|
GO:0035556~intracellular signal transduction |
16 |
7.96E-03 |
|
GO:0018105~peptidyl-serine phosphorylation |
8 |
8.40E-03 |
|
GO:0071456~cellular response to hypoxia |
7 |
8.60E-03 |
|
GO:0032000~positive regulation of fatty acid beta-oxidation |
3 |
1.12E-02 |
|
GO:1904754~positive regulation of vascular associated smooth muscle cell migration |
3 |
1.12E-02 |
|
GO:2000737~negative regulation of stem cell differentiation |
3 |
1.12E-02 |
|
GO:0031069~hair follicle morphogenesis |
4 |
1.30E-02 |
|
GO:0048015~phosphatidylinositol-mediated signaling |
7 |
1.36E-02 |
|
GO:0061418~regulation of transcription from RNA polymerase II promoter in response to hypoxia |
4 |
1.44E-02 |
|
GO:0060412~ventricular septum morphogenesis |
4 |
1.58E-02 |
|
GO:0048008~platelet-derived growth factor receptor signaling pathway |
4 |
1.58E-02 |
|
GO:0001503~ossification |
6 |
1.60E-02 |
|
GO:0031065~positive regulation of histone deacetylation |
3 |
1.66E-02 |
|
GO:2000773~negative regulation of cellular senescence |
3 |
1.66E-02 |
|
GO:0043410~positive regulation of MAPK cascade |
6 |
1.68E-02 |
|
GO:0042981~regulation of apoptotic process |
10 |
1.75E-02 |
|
GO:0006915~apoptotic process |
19 |
1.78E-02 |
|
GO:0042771~intrinsic apoptotic signaling pathway in response to DNA damage by p53 class mediator |
4 |
1.90E-02 |
|
GO:0008016~regulation of heart contraction |
4 |
1.90E-02 |
|
GO:0043517~positive regulation of DNA damage response, signal transduction by p53 class mediator |
3 |
1.97E-02 |
|
GO:0031581~hemidesmosome assembly |
3 |
1.97E-02 |
|
GO:0048705~skeletal system morphogenesis |
4 |
2.06E-02 |
|
GO:0050873~brown fat cell differentiation |
4 |
2.06E-02 |
|
GO:0042127~regulation of cell proliferation |
9 |
2.16E-02 |
|
GO:0017148~negative regulation of translation |
5 |
2.19E-02 |
|
GO:0001525~angiogenesis |
10 |
2.28E-02 |
|
GO:0097192~extrinsic apoptotic signaling pathway in absence of ligand |
4 |
2.42E-02 |
|
GO:0048661~positive regulation of smooth muscle cell proliferation |
5 |
2.45E-02 |
|
GO:0051289~protein homotetramerization |
5 |
2.45E-02 |
|
GO:0072593~reactive oxygen species metabolic process |
4 |
2.62E-02 |
|
GO:0010801~negative regulation of peptidyl-threonine phosphorylation |
3 |
2.65E-02 |
|
GO:0030177~positive regulation of Wnt signaling pathway |
4 |
2.82E-02 |
|
GO:0035024~negative regulation of Rho protein signal transduction |
3 |
3.03E-02 |
|
GO:0019933~cAMP-mediated signaling |
4 |
3.24E-02 |
|
GO:0030522~intracellular receptor signaling pathway |
4 |
3.24E-02 |
|
GO:0010832~negative regulation of myotube differentiation |
3 |
3.42E-02 |
|
GO:0006357~regulation of transcription from RNA polymerase II promoter |
15 |
3.43E-02 |
|
GO:0043524~negative regulation of neuron apoptotic process |
7 |
3.54E-02 |
|
GO:0060512~prostate gland morphogenesis |
2 |
3.65E-02 |
|
GO:1901862~negative regulation of muscle tissue development |
2 |
3.65E-02 |
|
GO:0030819~positive regulation of cAMP biosynthetic process |
4 |
3.70E-02 |
|
GO:0008283~cell proliferation |
13 |
3.88E-02 |
|
GO:0033138~positive regulation of peptidyl-serine phosphorylation |
5 |
4.00E-02 |
|
GO:0010629~negative regulation of gene expression |
7 |
4.12E-02 |
|
GO:0051496~positive regulation of stress fiber assembly |
4 |
4.18E-02 |
|
GO:0009411~response to UV |
4 |
4.18E-02 |
|
GO:0060348~bone development |
4 |
4.18E-02 |
|
GO:0001649~osteoblast differentiation |
6 |
4.31E-02 |
|
GO:0045444~fat cell differentiation |
5 |
4.55E-02 |
Table 2: Biological Process.
|
Term |
Count |
P Value |
|
GO:0005737~cytoplasm |
123 |
2.60E-04 |
|
GO:0005634~nucleus |
123 |
1.20E-03 |
|
GO:0016605~PML body |
8 |
1.83E-03 |
|
GO:0030018~Z disc |
8 |
5.16E-03 |
|
GO:0005886~plasma membrane |
94 |
5.89E-03 |
|
GO:0009986~cell surface |
19 |
8.57E-03 |
|
GO:0005654~nucleoplasm |
66 |
1.16E-02 |
|
GO:0032587~ruffle membrane |
6 |
1.54E-02 |
|
GO:0005667~transcription factor complex |
9 |
2.23E-02 |
|
GO:0005938~cell cortex |
7 |
2.27E-02 |
|
GO:0005829~cytosol |
74 |
2.66E-02 |
|
GO:0016020~membrane |
52 |
2.82E-02 |
|
GO:0030175~filopodium |
5 |
3.76E-02 |
|
GO:0000781~chromosome, telomeric region |
4 |
4.82E-02 |
|
GO:0005515~protein binding |
199 |
4.21E-06 |
|
GO:0042803~protein homodimerization activity |
29 |
1.57E-04 |
|
GO:0005524~ATP binding |
45 |
9.22E-04 |
|
GO:0001078~transcriptional repressor activity, RNA polymerase II core promoter proximal region sequence-specific binding |
9 |
9.34E-04 |
|
GO:0003713~transcription coactivator activity |
12 |
5.71E-03 |
|
GO:0008134~transcription factor binding |
13 |
5.82E-03 |
|
GO:0008307~structural constituent of muscle |
5 |
6.89E-03 |
|
GO:0001106~RNA polymerase II transcription corepressor activity |
4 |
1.13E-02 |
|
GO:0070888~E-box binding |
4 |
2.33E-02 |
|
GO:0043565~sequence-specific DNA binding |
17 |
2.73E-02 |
|
GO:0008083~growth factor activity |
8 |
2.84E-02 |
|
GO:0003779~actin binding |
11 |
3.07E-02 |
|
GO:0004714~transmembrane receptor protein tyrosine kinase activity |
4 |
3.12E-02 |
|
GO:0001102~RNA polymerase II activating transcription factor binding |
4 |
3.12E-02 |
|
GO:0003714~transcription corepressor activity |
9 |
3.19E-02 |
|
GO:0004713~protein tyrosine kinase activity |
7 |
3.43E-02 |
|
GO:0005520~insulin-like growth factor binding |
3 |
4.14E-02 |
|
GO:0005178~integrin binding |
6 |
4.23E-02 |
|
GO:0003677~DNA binding |
41 |
4.25E-02 |
|
GO:0003700~transcription factor activity, sequence-specific DNA binding |
26 |
4.47E-02 |
|
GO:0008022~protein C-terminus binding |
8 |
4.82E-02 |
Table 3: Cellular Components.
|
Term |
Count |
P Value |
|
GO:0005515~protein binding |
199 |
4.21E-06 |
|
GO:0042803~protein homodimerization activity |
29 |
1.57E-04 |
|
GO:0005524~ATP binding |
45 |
9.22E-04 |
|
GO:0001078~transcriptional repressor activity, RNA polymerase II core promoter proximal region sequence-specific binding |
9 |
9.34E-04 |
|
GO:0003713~transcription coactivator activity |
12 |
5.71E-03 |
|
GO:0008134~transcription factor binding |
13 |
5.82E-03 |
|
GO:0008307~structural constituent of muscle |
5 |
6.89E-03 |
|
GO:0001106~RNA polymerase II transcription corepressor activity |
4 |
1.13E-02 |
|
GO:0070888~E-box binding |
4 |
2.33E-02 |
|
GO:0043565~sequence-specific DNA binding |
17 |
2.73E-02 |
|
GO:0008083~growth factor activity |
8 |
2.84E-02 |
|
GO:0003779~actin binding |
11 |
3.07E-02 |
|
GO:0004714~transmembrane receptor protein tyrosine kinase activity |
4 |
3.12E-02 |
|
GO:0001102~RNA polymerase II activating transcription factor binding |
4 |
3.12E-02 |
|
GO:0003714~transcription corepressor activity |
9 |
3.19E-02 |
|
GO:0004713~protein tyrosine kinase activity |
7 |
3.43E-02 |
|
GO:0005520~insulin-like growth factor binding |
3 |
4.14E-02 |
|
GO:0005178~integrin binding |
6 |
4.23E-02 |
|
GO:0003677~DNA binding |
41 |
4.25E-02 |
|
GO:0003700~transcription factor activity, sequence-specific DNA binding |
26 |
4.47E-02 |
|
GO:0008022~protein C-terminus binding |
8 |
4.82E-02 |
Table 4: Molecular Function.
Survival Analysis of Hub Genes
The overall survival rate of the hub genes such as VEGFA, IGF1R, FOS, and MDM2 in CRC patients was analyzed using GenomicScape website(http://www.genomicscape.com/), a web tool to easily visualize and analyze high-throughput data. Hazard ratios (HRs) with 95% confidence intervals and log-rank P-values were calculated.
The Human Protein Atlas (HPA)
HPA is a public database with the aim to map all the human proteins in cells, tissues, and organs using an integration of various omics technologies, including antibody-based imaging, etc. [20,21]. HPA ( https://www.proteinatlas.org/ ) database contains proteomic data based on 26941 antibodies targeting 17165 unique proteins. The protein levels of VEGFA, IGF1R, FOS, and MDM2 between CRC and normal specimens were verified by Immunohistochemistry (IHC).
Statistical Analysis
In general, p<0.05 or p<0.01 was considered statistically significant in all cases if not otherwise specified. All the experiments were analyzed by either student t-test or ANOVA via Prism 9.0 (GraphPad Software, San Diego, USA) software.
Results
Screening of the Candidate Genes in Drug-Resistant CRC Cancer Cells
In order to select more appropriate candidate genes as drug targets in CRC cancer, we chose three independent GEO datasets for the follow-up analysis: GSE15395 dataset, containing 74 samples, compared dysregulated genes among HCT-116 cells treated with high, middle, and low doses of R547 (a CDK inhibitor) at early time point-1 hour [17]. GSE55624 dataset, composed of 18 biological samples, compared activated genes after SW480 cells were stimulated with tankyrase and MEK double inhibitors at a 4-hour time point versus the control group without any drugs [18]. GSE56496 dataset analyzed DEGs expression of SW620 cells treated for 48 hours with high dose supercritical rosemary extract [19]. Raw data had been downloaded from the NCBI website and pre-processed using GEO2R software, p values<0.01 and log2 fold change (FC) >2 folds were considered as the cut-off criteria, a total of 352 genes were identified by intersected analysis from the Venn diagram (Figure 1a). Visualized PPI was predicted by the online database STRING ( https://string-db.org/) and Cytoscape software, which represented the potential highest degree of affected genes after drug treatment in CRC cells (Figure 1b). Collectively, we speculated 352 drug-resistant genes detected in CRC cells, and we need further narrowed down our findings.
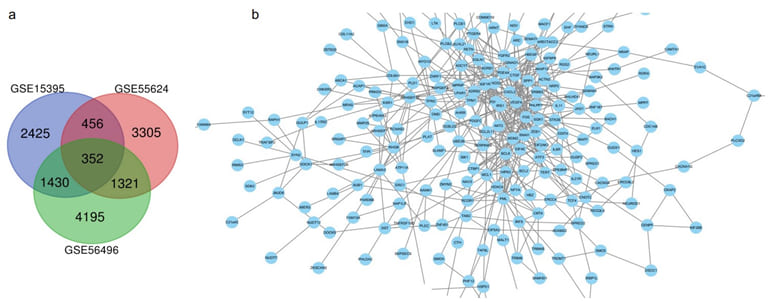
Figure 1: Venn diagram analysis and PPI network of differentially expressed genes (DEGs) among 3 GEO datasets. a. 352 Overlapping DEGs among 3 GEO datasets of CRC human samples treated with different drugs.
b. PPI networks among 352 overlapping genes.
Enrichment of Three Important Modules Among all the Candidate Genes
The most important biomarkers in CRC had been analyzed from highly interconnected subgraphs in a large PPI network (Figure 1b), top 3 modules of hub genes clusters to visualize DEGs as follows: the first modules of PPI network construction included PTGER4, ADCY7, ADRB1, PDE4A, RAPGEF3, IGF1R, ADRB2, VEGFA, AKT2, SNAI1, ZEB1 and JAG1 (Figure 2a); the second cluster of PPI networks included ERBB3, IRS1, FOS, SGK1, BCL2L11, EIF2AK3, EIF4E and MCL1 (Figure 2b); the third PPI networks contained PLCB1, PLCB2, FGFR2, AREG, HBEGF, GNAO1, CTGF, LPAR1, CXCL2, PHLPP1 and MDM2 (Figure 2c). Next, to enrich the most important biomarkers among DEGs, we trimmed down all top 3 modules of hub genes from the PPI network (Figure 2a,b,c) in the STRING website and visualized these genes in Cytoscape (Figure 2d), 4 genes labeled in red dots: VEGFA, IGF1R, FOS, and MDM2 stood out in the networks of this drug-resistant CRC cells. Furthermore, we imported these hub genes into the DAVID database for KEGG enrichment analysis, which enriched the PI3K-Akt signaling pathway, pathways in cancer, Rap1 signaling pathway, calcium signaling pathway, EGFR tyrosine kinase inhibitor resistance, endocrine resistance, adrenergic signaling in cardiomyocytes, cGMPPKG signaling pathway, chemical carcinogenesis - receptor activation, cAMP signaling pathway, etc (Figure 2e). Interestingly, VEGFA, IGF1R, FOS, and MDM2 were mainly involved in the top 5 pathways listed in Figure 2e. This result demonstrated these 4 genes may have biological functions to mediate drug resistance by affecting these 5 pathways, and they may become candidate biomarkers in the clinical application. We also searched the basic function of each gene from the genecards website (http://www.genecards.org):
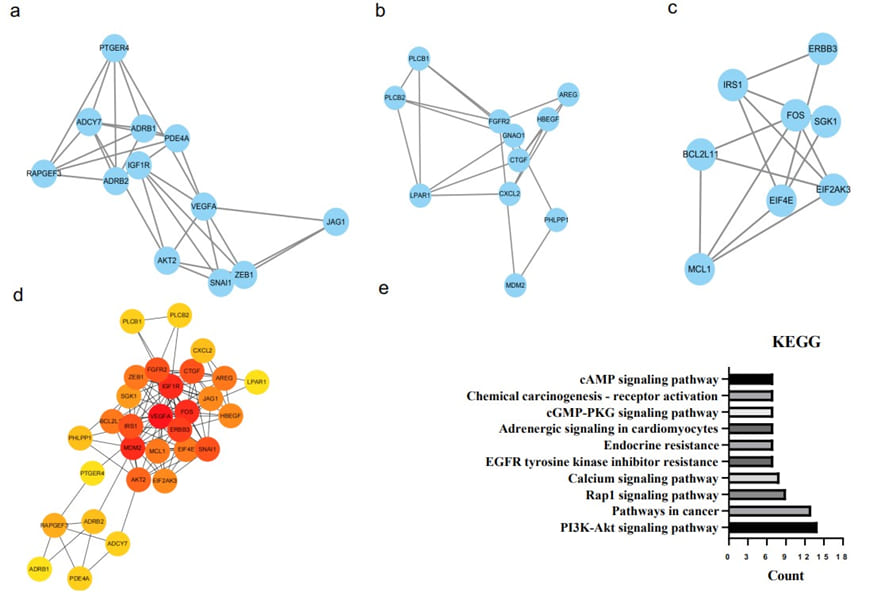
Figure 2: Enriched PPI networks and KEGG pathway analysis of the hub genes. a,b,c. Top 3 hub-gene networks derived from the overall network by cytoHubba and MCODE tools. d. PPI networks among all hub genes enriched from the above figures abc. The color red to yellow represented the decayed degree of this interaction. e. KEGG pathway analysis of all hub genes. The colors represent different pathways and the size of the node represents the counts of different pathways.
VEGFA Vascular endothelial growth factor A-induced cell proliferation and migration of vascular endothelial cells, essential for angiogenesis, inhibited apoptosis and induced permeabilization of blood vessels. It initiated motor neuron axon guidance and cell-body migration.
IGF1R Insulin-like growth factor 1 receptor binds insulin-like growth factor which possessed tyrosine kinase activity. It contained alpha and beta subunits. Phosphorylation of IRS proteins leads to the activation of two main signaling pathways: activation of the PI3K-AKT pathway inhibited apoptosis and stimulated protein synthesis; activation of the Ras-MAPK pathway increased cellular proliferation. PI3K signaling and the ras-MAPK pathway are two main signaling pathways. IGF1R can activate Janus kinase/signal transducer and activator of transcription pathway (JAK/STAT).
FOS Fos Proto-Oncogene, AP-1 Transcription Factor Subunit encodes leucine zipper proteins. It consists of 4 family members: FOS, FOSB, FOSL1, and FOSL2. The FOS protein is implicated to play a role in the regulation of cell proliferation, differentiation, and transformation. FOS can form a complex with the JUN/AP-1 transcription factor. It also can form a multimeric SMAD3/SMAD4/JUN/ FOS complex to regulate TGF-beta-mediated signaling.
MDM2 E3 Ubiquitin-Protein Ligase can promote tumor formation by degradation of tumor suppressor protein P53. MDM2 associated lessel-kubisch syndrome and accelerated tumor formation.
PTGER4 was a member of the G-protein coupled receptor family. This receptor belongs to one of four receptors prostaglandin E2 (PGE2) which induced expression of early growth response 1 (EGR1) and can activate T-cell factor signaling. PTGER4 regulated the level and stability of cyclooxygenase-2 mRNA leading to the phosphorylation of glycogen synthase kinase (GSK)-3.
ADCY7 converted ATP to cyclic AMP but was inhibited by calcium. This gene contained various transcripts. Functions in signaling cascades activated namely by dopamine and C5 alpha chain and mediate regulation of cAMP synthesis (PubMed:23842570, PubMed:23229509).
ADRB1 The adrenergic receptors contained various subtypes: ɑ-1,ɑ-2, ß-1, and ß-2. It belonged to guanine nucleotide-binding regulatory protein-coupled receptors, which interacted with the hormone epinephrine and the neurotransmitter norepinephrine in an affinity or tissue-specific manner.
PDE4A The protein encoded by this gene belongs to the cyclic nucleotide phosphodiesterase (PDE) family, and the PDE4 subfamily. This PDE hydrolyzes the second messenger, cAMP. This protein plays a key role in many important physiological processes by regulating the cellular concentration of cAMP. Alternatively, spliced transcript variants encoding different isoforms have been described for this gene.
RAPGEF3 Rap guanine nucleotide exchange factor 3 can be activated by binding cAMP. It activated the PI3K gamma complex which involved in angiogenesis. It modulated cAMP-induced dynamic control of endothelial barrier function requiring the actin rearrangement.
ADRB2 ß2-adrenergic receptor belongs to G protein-coupled receptor superfamily binding to epinephrine with an approximately 30-fold greater affinity than it does norepinephrine. It is associated with the risk of Parkinson’s disease.
AKT2 V-Akt Murine Thymoma Viral Oncogene Homolog 2 is a putative oncogene encoding a protein belonging to a subfamily of serine/threonine kinases. Pancreatic cancer detected higher expression of AKT2. AKT2 activated mTORC1 signaling causing phosphorylation of 4E-BP1 and RPS6KB1. AKT can regulate NFkappa-B dependent gene transcription to promote pro-survival gene expressions such as BCL2 and MCL1.
SNAI1 Snail Family Transcriptional Repressor 1 is a zinc finger transcriptional repressor involved in epithelial-to-Mesenchymal Transition (EMT), growth arrest, survival, and cell migration.
ZEB1 Zinc Finger E-Box Binding Homeobox 1 acted as a transcriptional repressor to inhibit interleukin-2 (IL-2) gene expression.
JAG1 Jagged Canonical Notch Ligand 1 (PubMed:18660822, PubMed:20437614) may be involved in cell-fate decisions during hematopoiesis (PubMed:9462510), enhanced fibroblast growth factor-induced angiogenesis in vitro.
ERBB3 V-Erb-B2 Avian erythroblastic Leukemia Viral Oncogene Homolog 3 encodes a member of the Epidermal Growth Factor Receptor (EGFR) family of Receptor Tyrosine Kinases (RTK), leading to cell proliferation or differentiation. EGFR belongs to the ErbB family. Four members of the ErbB family have been identified; EGFR (ErbB1, HER1), ErbB2 (HER2), ErbB3 (HER3) and ErbB4 (HER4). Upregulation of ERBB3 has been reported in many cancer types including prostate, bladder, and breast tumors, etc.
IRS1 Insulin Receptor Substrate 1 encodes a protein that is phosphorylated by insulin RTK. It is involved in insulin-regulated various cellular processes.
SGK1 Serine/Threonine-Protein Kinase1 activates certain potassium, sodium, and chloride channels, to regulate ion channels (renal sodium excretion), membrane transporters, neuronal excitability, cell survival, migration, and apoptosis. Overexpression of SGK1 may contribute to hypertension and diabetic nephropathy.
BCL2L11 Bcl-2 Interacting Mediator of Cell Death, this protein belongs to the BCL-2 protein family, which forms dimers to act as anti-or pro-apoptotic regulators. The expression of this gene can be induced by nerve growth factor (NGF), as well as by the forkhead transcription factor FKHR-L1, involved in neuronal and lymphocyte apoptosis.
EIF2AK3 Eukaryotic Translation Initiation Factor 2 Alpha Kinase can modulate mitochondrial morphology and function. It contributed to Early-Onset Diabetes Mellitus and Neonatal Diabetes Mellitus.
EIF4E Eukaryotic Translation Initiation Factor 4E acted as a proto-oncogene, was associated with tumorigenesis. It involved in Autism and pervasive developmental disorder. P38 signaling affecting insulin-like growth factor (IGF1)-Akt signaling related to this gene.
MCL1 Apoptosis Regulator which belongs to BCL2 family members, functions as a double-edged sword to either enhance or suppress cell survival in regulation of apoptosis. It involved in myeloid leukemia and chlamydia.
PLCB1 Phospholipase C Beta 1 activated by two G-protein subunits, involved in disease of epileptic encephalopathy, early infantile, and malignant migrating partial seizures of infancy.
PLCB2 Phospholipase C Beta 2 involved in the type 2 taste receptor signal transduction pathway. In addition, nuclear factor kappa B served as its upstream regulator to mediate platelet responses. PLCB2 was associated with prostate leiomyosarcoma and sarcoma.
FGFR2 Fibroblast Growth Factor Receptor 2 is a member of the fibroblast growth factor receptor family. The protein consists of an extracellular region, three immunoglobulin-like domains, a single hydrophobic membrane-spanning segment and a cytoplasmic tyrosine kinase domain. FGF ligand binds to FGFR2 to initiate mitogenesis, differentiation, cell proliferation, migration, apoptosis and the regulation of embryonic development as well as mediating activation of RAS, MAPK signaling pathway. This gene involved in Pfeiffer Syndrome and Jackson-Weiss Syndrome.
AREG Colorectum Cell-Derived Growth Factor is a member of the epidermal growth factor family. The protein interacts with the EGF/TGF-ɑ receptor to promote the growth of normal epithelial cells. This gene involved ovarian cystadenoma and colorectal cancer.
HBEGF Diphtheria Toxin Receptor (Heparin-Binding EGF-Like Growth Factor) related to RET signaling and served as B Cell Receptor (BCR) downstream signaling. This gene was required for normal cardiac valve formation and normal heart function. It promoted smooth muscle or macrophage-mediated cellular proliferation.
GNAO1 G Protein Subunit Alpha O1 represents the alpha subunit of the G-protein signal-transducing complex. It is associated with the disease of epileptic encephalopathy, early infantile, and neurodevelopmental disorder with involuntary movements.
CTGF Connective Tissue Growth Factor also known as cellular communication network factor 2 is a mitogen, secreted by vascular endothelial cells. The protein plays a role in chondrocyte proliferation and differentiation, cell adhesion, and is related to platelet-derived growth factor. This gene is related to the disease of renal fibrosis and systemic scleroderma and ERK signaling and the TGF-ß Pathway.
LPAR1 Lysophosphatidic Acid Receptor 1 is a member of the G protein-coupled receptor superfamily to mediate diverse biologic functions, such as remodeling actin cytoskeleton, cell invasion, proliferation, and differentiation which have responses to tissue damage and infectious agents, platelet aggregation, smooth muscle contraction, inhibition of neuroblastoma cell differentiation and chemotaxis including responses to injury and wounding (PubMed:18066075). LPAR1-activated G proteins downstream signaling cascades to decrease cellular cAMP levels (PubMed:26091040).
CXCL2 Chemokine (C-X-C Motif) Ligand 2 encodes secreted proteins involved in immunoregulatory and inflammatory processes. It may suppress hematopoietic progenitor cell proliferation. CXCL2 is associated with Peritonitis and Pneumonia disease.
PHLPP1 PH Domain And Leucine Rich Repeat Protein Phosphatase 1 encodes a member of the serine/threonine phosphatase family. This protein promoted apoptosis via inhibition of Akt and functions as a tumor suppressor in various cancer types. Upregulation of PHLPP1 plays a role in obesity, and type 2 diabetes by interfering with Akt-mediated insulin signaling and colorectal cancer.
The alteration frequency of important hub genes in CRC subtypes and patients
Precision medicine appeared due to individual diversity, therefore we decided to explore the alteration frequency of the candidate hub genes in several CRC subtypes. The mRNA expression of VEGFA, IGF1R, and FOS in three CRC subtypes varied (Figure 3). Mucinous adenocarcinoma accounted for 1015% of CRC patients and had an abnormal and more aggressive pattern which was associated with an inferior response to treatment and worse prognosis compared with colon and rectal adenocarcinoma [22]. In mucinous adenocarcinoma of the colon and rectum, VEGFA, IGF1R, and FOS were upregulated, which indicated all three candidate genes may promote drug resistance in the mucinous adenocarcinoma subtype. In colon adenocarcinoma, IGF1R and FOS were either partly upregulated or partly downregulated, while VEGFA was stably upregulated. In rectal adenocarcinoma, VEGFA and FOS were highly expressed, while IGF1R was partly downregulated. These results suggested that VEGFA was oncogenic in colon adenocarcinoma especially when patients detected uncertain up/down regulated molecules as we speculated the expression of IGF1R, FOS, and VEGFA, CRC patients may be at the benign stage which had a good response to targeted therapy.

Figure 3: Alteration frequency of mRNA levels of selected genes.a,b,c Alteration frequency of their hub genes, VEGFA(a), IGF1R (b), and FOS (c), in different CRC subtypes.
Interestingly, among all the genes, VEGFA is the only gene upregulated in 3 CRC cancer types, suggesting that VEGFA was an oncogenic biomarker that can predict the initial response to the treatment. Furthermore, the other two genes were probably involved in the acquired resistance and need real-time surveillance during the treatment. Of note, we found that the expression of all three genes was ectopically expressed in colon adenocarcinoma of the CRC patients (Figure 4). In a summary, these hub genes might be potential biomarkers by detecting their mRNA level in CRC patients but their clinical relevance should be further investigated.

Figure 4: Heatmap analysis of first and second enriched hub-gene networks . a, b. The mutation frequency of genes from the first (a) or second (b) hub-gene network in 222 CRC patients. The red or blue represents selected genes that are upregulated or downregulated in CRC patients, respectively.
Prognostic value of Candidate Hub Genes in CRC
The clinical relevance of VEGFA, IGF1R, FOS, and MDM2 molecules in CRC patients had been evaluated using the overall survival rate generated by the GenomicScape website. Within our expectation, high expression of VEGFA, FOS, and MDM2 in CRC patients had a significantly shorter lifespan compared to their counterpart group (Figure 5a,c,d). It indicated the three genes could be malignant biomarkers. However, the expression of IGF1R was not related to patients’ overall survival rate (Figure 5b). The protein level of candidate hub genes in human CRC tumors and normal tissues had been compared by immunohistochemistry staining in the HPA database.We found VEGFA, IGF1R, FOS and MDM2 expression in CRC tissue was significantly higher than those in normal tissues (Figure 6). These results demonstrated that these hub genes might also serve as a diagnostic biomarker in CRC. Collectively, we verified that all four hub genes had a prognostic value in the clinical setting and it suggested that these genes might be potential biomarkers for predicting the treatment response of CRC.

Figure 5: Overall Survival analysis of 4 candidate hub genes in CRC patients.a,b,c,d Overall survival curves for VEGFA(a), IGF1R (b), FOS (c), and MDM2(d).

Figure 6: Protein staining of 4 candidate genes between the normal colon and colorectal cancer tissues. a. Protein level of VEGFA in CRC tissue (Bottom) and normal tissue (Top). b. Protein level of IGF1R in CRC tissue (Bottom) and normal tissue (Top). c. Protein level of FOS in CRC tissue (Bottom) and normal tissue (Top). d. Protein level of MDM2 in CRC tissue (Bottom) and normal tissue (Top)
Discussion
Although targeted therapy made rapid progress in patients with many cancer types, the majority of CRC patients failed the targeted therapy due to drug resistance, which kept CRC the second deadliest cancer [1,3,13]. Therefore, the mechanism of drug resistance needs to be clarified. We screened VEGFA as the most significant drug resistance-related molecule. Consistent with our finding, Shuyang Wang et al. recently reported that VEGFA, transcriptionally activated by FOXF1(Forkhead box F1), a transcription factor belonging to the FOX family, elevated angiogenesis and mediated bevacizumab resistance by upregulating the p-AKT and p-MEK in CRC [23]. Immunotherapy is usually considered a promising combined therapy when standard chemotherapy and targeted therapy lacked good response in patients [24]. However, VEGFA had been also reported to boost the exhaustion of CD8+ T cells, mediating the anti-PD-1 drug resistance by increasing the transcription factor TOX, which induced the PD-1, TIM-3, and LAG-3 to enhance the exhaustion process in Microsatellite Stable (MSS) CRC [25]. Moreover, VEGFA, sponged by miR-126-3p, inhibited cell proliferation and invasiveness of dabrafenib (a MEK inhibitor)-resistant melanoma cells and VEGFA serum level was relatively high which could be the reason why MEK inhibitor had no response to melanoma patients [26]. It suggested combining drugs targeting both VEGFA and MEK at the early stage of patients may have better clinical outcomes.
Furthermore, IGF1R was the second most vital gene mediating drug resistance in our screening results. Dasatinib (a tyrosine kinase SRC inhibitor) induced IGF1R accumulated higher expression in the nuclear of oxaliplatin-resistant CRC cells [27]. It indicated that IGF1R not only mediated chemoresistance but it also contributed to the resistance of targeted therapy in CRC. Translocation of the IGF1R from the cellular membrane to the nucleus induced eribulin resistance in CRC and pharmacological inhibition of IGF1R enhanced eribulin’s cytotoxicity through abrogating the expression of CDK1 [28]. It suggested IGF1R also played an indispensable role in mediating CDK inhibitorsresistance. IGF1R had been validated to confer resistance to CDK4/6 inhibitors in Ewing sarcoma cell lines and the combination of the IGF1R inhibitor and the CDK4/6 inhibitor significantly impaired tumor progression and prolonged survival rate compared to the single use of CDK4/6 inhibitor in 2 xenograft models of Ewing sarcoma [29]. In summary, IGF1R may be a candidate drug target or could be functioned as a combining medicine with SRC/ CDK inhibitors to relieve chemoresistance of various cancer types.
MDM2, a nuclear-localized E3 ubiquitin ligase, was identified in PiHL(a long non-coding RNA)-mediating p53 degradation resulting in 5-FU resistance in CRC [30]. Furthermore, p53 degradation was enhanced by MDM2-p53 interaction in oxaliplatin-resistant CRC cells [31]. Moreover, the RIOK1(RIO Kinase 1)-G3BP2(an RNA binding molecule)MDM2 axis, facilitated the ubiquitination of p53, contributing to CRC radioresistance [32]. Moreover, MDM2-p53 was stabilized by prohibitin 2 to increase the eribulin resistance in gastric cancer [33]. These results suggested that MDM2 usually mediated drug resistance by boosting the ubiquitination of p53 in various cancers. Therefore, restoring p53 activity may be a beneficial way to overcome MDM2-mediated drug resistance.
MEK/ERK/FOS pathway, activated by APEX1(a DNA repair enzyme), involved DOX resistance in gastric cancer [34]. FOS, transcriptionally upregulated by miR-744, facilitated the radio/ chemo-resistance in non-small cell lung cancer [35]. It indicated that combining the MEK/FOS inhibitors and chemotherapy may render the patients sensitive to the chemotherapy clinically. In conclusion, all 4 of the most significant genes may be identified as promising drug targets for overcoming drug resistance in diverse cancer treatments, especially in CRC.
Acknowledgment
We thank for Helixlife providing the bioinformatics online courses. PPZY2015B146 (to Jinghua Chen) Top-notch Academic Programs Project of Jiangsu Higher Education Institutions.
BK20190593 (to Chen Chen) Natural Science Foundation of Jiangsu Province of China 2020M681492 (to Chen Chen) Chinese Post-Doc Science Funds.
References
- Das PK, Islam F, Lam AK (2020) The Roles of Cancer Stem Cells and Therapy Resistance in Colorectal Carcinoma. Cells 9.
- Schmoll HJ, Van Cutsem E, Stein A, Valentini V, Glimelius B, et al. (2012) ESMO Consensus Guidelines for management of patients with colon and rectal cancer. a personalized approach to clinical decision Ann Oncol 23: 2479-2516.
- Di Nicolantonio F, Vitiello PP, Marsoni S, Siena S, Tabernero J, et (2021) Precision oncology in metastatic colorectal cancer - from biology to medicine. Nat Rev Clin Oncol 18: 506-525.
- Zhang M, Zhang L, Hei R, Li X, Cai H, et al. (2021) CDK inhibitors in cancer therapy, an overview of recent development. Am J Cancer Res 11: 1913-1935.
- Krushkal J, Silvers T, Reinhold WC, Sonkin D, Vural S, et al. (2020) Epigenome-wide DNA methylation analysis of small cell lung cancer cell lines suggests potential chemotherapy targets. Clin Epigenetics 12: 93.
- Hacioğlu B, Kuş G, Kutlu HM, Kabadere S (2020) The effect of R547, a cyclin-dependent kinase inhibitor, on hepatocellular carcinoma cell Turk J Biol 44: 24-33.
- Markham A, Keam SJ (2020) Selumetinib: First Approval. Drugs 80: 931-937.
- van Brummelen EMJ, Huijberts S, van Herpen C, Desar I, Opdam F, et al. (2021) Phase I Study of Afatinib and Selumetinib in Patients with KRAS-Mutated Colorectal, Non-Small Cell Lung, and Pancreatic Oncologist 26.
- Gaudreau P-O, Lee JJ, Heymach JV, Gibbons DL (2020) Phase I/II Trial of Immunotherapy With Durvalumab and Tremelimumab With Continuous or Intermittent MEK Inhibitor Selumetinib in NSCLC: Early Trial Report. Clin Lung Cancer 21: 384-388.
- Atanasov AG, Zotchev SB, Dirsch VM, Supuran CT (2021) Natural products in drug discovery: advances and opportunities. Nat Rev Drug Discov 20: 200-216.
- Bouzas A, Gómez de Cedrón M, Colmenarejo G, Laparra-Llopis JM, Moreno-Rubio J, et al. (2022) Phenolic diterpenes from Rosemary supercritical extract inhibit non-small cell lung cancer lipid metabolism and synergise with therapeutic drugs in the clinic. Front Oncol 12:
- O’Neill EJ, Moore J, Song J, Tsiani EL (2021) Inhibition of Non-Small Cell Lung Cancer Proliferation and Survival by Rosemary Extract Is Associated with Activation of ERK and AMPK. Life (Basel) 12.
- Sveen A, Kopetz S, Lothe RA (2020) Biomarker-guided therapy for colorectal cancer: strength in complexity. Nat Rev Clin Oncol 17: 11
- Phipps AI, Buchanan DD, Makar KW, Win AK, Baron JA, et al. (2013) KRAS-mutation status in relation to colorectal cancer survival: the joint impact of correlated tumour markers. Br J Cancer 108: 1757-1764.
- Roth MT, Das S (2021) Pembrolizumab in unresectable or metastatic MSI-high colorectal cancer: safety and efficacy. Expert Rev Anticancer Ther 21: 229-238.
- Etienne-Grimaldi MC, Mahamat A, Chazal M, Laurent-Puig P, Olschwang S, et al. (2014) Molecular patterns in deficient mismatch repair colorectal tumours: results from a French prospective multicentric biological and genetic study. Br J Cancer 110: 2728-2737.
- Berkofsky-Fessler W, Nguyen TQ, Delmar P, Molnos J, Kanwal C, et al. (2009) Preclinical biomarkers for a cyclin-dependent kinase inhibitor translate to candidate pharmacodynamic biomarkers in phase I patients. Molecular cancer therapeutics 8: 2517-2525.
- Schoumacher M, Hurov KE, Lehár J, Yan-Neale Y, Mishina Y, et al. (2014) Inhibiting Tankyrases sensitizes KRAS-mutant cancer cells to MEK inhibitors via FGFR2 feedback signaling. Cancer research 74: 3294-3305.
- González-Vallinas M, Molina S, Vicente G, Zarza V, MartínHernández R, et al. (2014) Expression of microRNA-15b and the glycosyltransferase GCNT3 correlates with antitumor efficacy of Rosemary diterpenes in colon and pancreatic cancer. PloS one 9:
- Gyorffy B, Lánczky A, Szállási Z (2012) Implementing an online tool for genome-wide validation of survival-associated biomarkers in ovariancancer using microarray data from 1287 patients. Endocr Relat Cancer 19: 197-208.
- Uhlen M, Zhang C, Lee S, Sjöstedt E, Fagerberg L, et al. (2017) A pathology atlas of the human cancer transcriptome. Science 2017:
- Hugen N, Brown G, Glynne-Jones R, de Wilt JHW, Nagtegaal ID (2016) Advances in the care of patients with mucinous colorectal Nat Rev Clin Oncol 13: 361-369.
- Wang S, Xiao Z, Hong Z, Jiao H, Zhu S, et al. (2018) FOXF1 promotes angiogenesis and accelerates bevacizumab resistance in colorectal cancer by transcriptionally activating VEGFA. Cancer Lett 439: 78-90.
- Lichtenstern CR, Ngu RK, Shalapour S, Karin M (2020) Immunotherapy, Inflammation and Colorectal Cancer. Cells 9.
- Kim CG, Jang M, Kim Y, Leem G, Kim KH, et al. (2019) VEGF-A drives TOX-dependent T cell exhaustion in anti-PD-1-resistant microsatellite stable colorectal cancers. Sci Immunol 4.
- Caporali S, Amaro A, Levati L, Alvino E, Lacal PM, et al. (2019) miR126-3p down-regulation contributes to dabrafenib acquired resistance in melanoma by up-regulating ADAM9 and VEGF-A. J Exp Clin Cancer Res 38: 272.
- Codony-Servat J, Cuatrecasas M, Asensio E, Montironi C, MartínezCardús A, et al. (2017) Nuclear IGF-1R predicts chemotherapy and targeted therapy resistance in metastatic colorectal cancer. Br J Cancer 117: 1777-1786.
- Yoshihiro T, Ariyama H, Yamaguchi K, Imajima T, Yamaga S, et al. (2022) Inhibition of insulin-like growth factor-1 receptor enhances eribulin-induced DNA damage in colorectal cancer. Cancer Sci 2022.
- Guenther LM, Dharia NV, Ross L, Conway A, Robichaud AL, et al. (2019) A Combination CDK4/6 and IGF1R Inhibitor Strategy for Ewing Clin Cancer Res 25: 1343-1357.
- Deng X, Li S, Kong F, Ruan H, Xu X, et al. (2020) Long noncoding RNA PiHL regulates p53 protein stability through GRWD1/RPL11/MDM2 axis in colorectal cancer. Theranostics 10: 265-280.
- Wang Z, Zhan Y, Xu J, Wang Y, Sun M, et al. (2020) β-Sitosterol Reverses Multidrug Resistance via BCRP Suppression by Inhibiting the p53-MDM2 Interaction in Colorectal Cancer. J Agric Food Chem 68: 3850-3858.
- Chen Y, Zhou S, Wan K, Yu L, Zhao C, et al. (2022) RIOK1 mediates p53 degradation and radioresistance in colorectal cancer through phosphorylation of G3BP2. Oncogene 41: 3433-3444.
- Sakai H, Kawakami H, Teramura T, Onodera Y, Somers E, et al. (2021) Folate receptor α increases chemotherapy resistance through stabilizing MDM2 in cooperation with PHB2 that is overcome by MORAb-202 in gastric cancer. Clin Transl Med 11: e454.
- He H, Song F, Gao Q, Lu Z, Yuan Y, et al. (2021) The APEX1/miRNA27a-5p axis plays key roles in progression, metastasis and targeted chemotherapy of gastric cancer. Int J Pharm 599: 120446.
- Li S, Qiao S, Li N, Zhu X (2022) MiR-744 Functions as an Oncogene Through Direct Binding to c-Fos Promoter and Facilitates Non-small Cell Lung Cancer Progression. Annals of Surgical Oncology 29: 1465