 research article
 RNAseq Analysis of Figured and Non-Figured Acacia koa Wood
Shaneka S. Lawson1*, Ketaki P. Bhide2, Jyothi Thimmapuram2
1Department of
Forestry and Natural Resources, USDA Forest Service, Purdue University, USA
2Department of Bioinformatics Core, Purdue University, USA
*Corresponding author: Shaneka S. Lawson, 715 W. State Street, USDA Forest Service, Northern Research Station, Hardwood Tree Improvement and Regeneration Center (HTIRC), Purdue University, PFEN126A, W. Lafayette, Indiana 47907, USA. Tel: +17658088188; Fax: +17654949461; Email: sslawson@fs.fed.us
Received Date: 10 April, 2018; Accepted Date: 16 April, 2018; Published Date: 23 April, 2018
Citation: Lawson SS, Bhide KP, Thimmapuram J (2018) RNAseq Analysis of Figured and Non-Figured Acacia koa Wood. Curr Trends Forest Res: CTFR-113. DOI: 10.29011/ CTFR-108. 100013
1. Abstract
Koa (Acacia koa) are tropical hardwoods endemic to the Hawaiian archipelago and a source of highly figured wood. Technological advancements, combined with our greater understanding of wood fiber development, allow us to use more in depth methods to study the figured wood phenomenon. This study represents the first transcriptomic analysis of figure formation in koa. Transcriptome profiles of figured and non-figured koa indicated that 19 genes were differentially expressed (DE) to a significant level (FDR < 0.05) between highly figured (HiFig), lightly figured (LoFig), and non-figured koa (NoFig) that were also involved in lignin biosynthesis, the phenylpropanoid pathway, jasmonate biosynthesis, and sucrose – starch synthesis. A total of 1,663 genes were identified where HiFig significantly differed from LoFig and NoFig at FDR < 0.05 and, at FDR < 0.01, the number was reduced to 958 candidate genes for further evaluation. Genes were further filtered at log2FC of +/- 2 in at least one pairwise comparison, resulting in a reduction from 1,663 and 958 to 341 and 221 genes. The direct role of any one transcript in generation of figure is not yet understood however, we note WAT1 and 5NG4 as candidates for future, more directed studies of the figured wood phenomenon.
2. Keywords: Acacia koa; Figured Wood; Lignin Biosynthesis; RNAseq; Transcriptomics
1. Introduction
Wood originating from a diverse array of tree species differs in form and strength. When comparisons are made between tree species, the most common explanations for the erraticism in strength were variation in abundance and orientation of the xylem polymers cellulose, hemicellulose, and lignin [1,2]. Disarray of xylem polymers, or spiraling, can be a common phenomenon in many tree species. While often a very visually appealing trait, spiraled wood is unsuitable for use in construction as the strength and stability of the material is compromised [3-5].
Koa (Acacia koa) is among more than twelve hundred members of the genus Acacia and is one of the most valuable tropical hardwoods in the world. Koa trees can grow to be nearly one 30 meters tall and more than nine meters in circumference. Koa trees also exhibit variability between both colour and figure. Figure is a variation or distortion of the natural grain patterning within a tree so that wood cell fibers no longer appear uniform in direction or alignment. Disparities in the alignment of wood cells can be identified as interlocked, irregular, spiral, or wavy [6]. Interlocked grain is the term used when spiraling wood periodically switches directionality from left to right [4]. This alternation in direction can provide additional stability and is more desired that a simple spiral pattern. Interlocked grain has been reported in a significant number of tropical tree species and may decrease risks associated with radial splitting in adult trees with spiral grain patterns [7].
Despite concentrated efforts by numerous researchers, we are still no closer to elucidating the mechanisms behind figure formation in any of the species that exhibit the trait. Recent findings have suggested figure development is not linked exclusively to genetics nor can environmental stressors be the main cause for its generation [8,9]. Throughout the 1900s the “birds-eye” variety of figure was proposed to be linked to numerous developmental mechanisms such as adventitious bud formation, abnormal metabolic processes, and plant defense response to bird-peck injuries and insect damage [10,11].
Regardless of conjecture and anecdotal remarks regarding how figure is developed and how it may be propagated; no scientific evidence has been made available. However, figure can be generated in response to compression in the form of tension wood or formed during burl development. Burls are bark encased tumor-like growths that can be found on trunks, branches, or even on underground tissues. Grain patterns within burls are often abnormal, have been attributed to the existence of dormant buds, and can reliably be assumed to contain figure. Research has shown that crotch wood has also consistently exhibited figure. These three instances are the only known concessions to the theory that figure formation cannot be predicted. Few other theories have proven to be accurate in the prediction of figure establishment although the possibility exists that conventional breeding or grafting can be used to propagate figured individuals. Reliably produced figure is most likely the result of a combination of genetics and exposure to a particular set of environmental factors.
Wood formation is the result of an intricately coordinated and complex process that has yet to be fully understood. Numerous genes and gene families are involved in varied aspects of tree growth from programmed cell death and the formation of heartwood, to cell differentiation into bark and phloem. The phenylpropanoid pathway is extensive and connected to everything from production of anthocyanins and flavonoids, to generation of lignin and wood. A lengthy sequence of reactions is used to convert phenylalanine into many end products including lignin in plants (Figure S1). Lignin is a complex polymer of monolignols and the final destination for nearly 30% of carbon fixed during photosynthesis. It is second to cellulose as the most abundant organic polymer in plants and on Earth [12,13]. The role of lignin is to provide rigidity for cell walls, protect cells from pathogens, and maintain osmotic potentials by preventing water intrusion. There are three possible forms of lignin resulting from the phenylpropanoid pathway H, R, and S. The primary forms found in softwoods are G, and to a lesser degree, H. Hardwoods are primarily composed of G and S lignin.
Sucrose metabolism requires cleavage of multiple isoforms of sucrose synthase by invertases to aid numerous biochemical processes within plants such as biosynthesis of cell wall components and cell expansion. Thus, enzymes responsible for cleaving sucrose are also instrumental in the regulation of cell wall development by influencing the regulation of cell wall differentiation genes [14]. Methyl jasmonate is a volatile organic compound derived from jasmonates (JAs) which is produced in response to wounding and other biotic and abiotic stresses. This compound stimulates synthesis of defense chemicals [15], resin ducts [16], and has roles in cell death [17]. Additionally, JAs affect the signal stimulation and regulation of nodules in legumes [18]. The DE genes within these three pathways were selected for further study in figured and non-figured koa, as there exists many gaps in our knowledge of how genes in these pathways function for species outside of traditional model plant species.
This project used RNAseq combined with Illumina sequencing to characterize the upregulation or downregulation of genes that may be linked to the formation of figure. We used previously published pathway information for species such as Arabidopsis (Arabidopsis thaliana), soybean (Glycine max), and poplar (Poplar trichocarpa) as the basis for incorporation of genes discovered during data analysis for koa. The tetraploid genome of koa is unusual as most trees species are diploid. However, exceptions have been found in some species of oak [19], poplar [20], and apple (Malus × domestica) [21]. This study benefits examinations of other tree species that form figure such as ash (Fraxinus spp.), walnut (Juglans spp.), maple (Acer spp.), and poplar (Populus spp.) by providing a selection of genes for the basis of initial figure analyses. We must stress that the figure examined here is from a section of the bole that displayed high, low, or no figure across our cookie sample. We do not make claims that our cookie sample is representative of the entire tree.
The pathways presented here may ultimately be adjusted as more information is obtained regarding regulation of the genes therein. It is not our intention to uncover every possible gene involved in the process rather, to narrow down the possibilities by a significant number so that additional studies on these particular genes can be implemented. We found thousands of differentially expressed (DE) genes but narrowed that number based on comparison of highly-figured (HiFig), low level figure (LoFig), and non-figured (NoFig) samples. We hypothesize that the genes identified in this study are indeed involved in the initiation and development of figure formation in koa.
2. Methods
Fourteen cookie samples (5 HiFig, 5 LoFig, and 4 NoFig) were taken from a private koa plantation undergoing harvest located on Hawai’i Island. As each tree was felled, a cookie was cut from the stump end, immediately placed into a pre-labeled bag, and buried in dry ice. The frozen cookies were packaged and shipped from Hawai’i to Purdue University in Indiana. The bags were removed from dry ice and placed into a -80 °C freezer immediately upon arrival at Purdue. A simple flow chart of the process (Figure S2).
2.1. RNA Extraction
Cookies were cut into smaller chunks and categorized as high-, low-, or no-figure by two independent wood experts at the Purdue University Wood Research Lab (https://ag.purdue.edu/fnr/Pages/labwoodresearch.aspx). Cookies were removed from the freezer and placed in a steel pan of liquid nitrogen before being broken into slices with a pre-chilled hammer and chisel. The slices were then collected and placed into labeled 50 ml conical tubes (Corning®, USA) and moved to the -80 °C freezer. After resting for 24 h, individual tubes were removed, and the contents were placed into a freezer mill tube (SPEX®, USA) and presoaked in liquid nitrogen before the wood slices were ground into powder. The freshly ground powder was again placed in the -80 °C freezer overnight. RNA was extracted from the wood using the RNeasy® Plant Mini Kit (QIAGEN®, Germany) the following day. Resultant RNA yield was examined by Nanodrop 8000 (Thermo Fisher Scientific Inc., USA) after the addition of 1 μl RNasin® (Promega Corporation, USA). RNA quality was determined on an RNA 6000 nano chip (Agilent Technologies, USA) after denaturation and final quality confirmed with an electropherogram.
2.2. RNA Library Construction
Fourteen barcoded libraries were generated according to manufacturer’s instructions for the Illumina RNA TruSeq kit (Illumina®, USA). A total of 2 μg of high quality RNA was used for each individual sample. Library quality was determined using the Agilent Bioanalyzer 2100 (Agilent Technologies, USA) before the barcoded libraries were pooled to ensure equimolar sample representation. The libraries were reverse-transcribed and sequenced on the Illumina HiSeq2000 platform. De novo assembly using Transcriptome Assembly by Short Sequences (Trans-ABySS, v.1.5.3) was employed to generate a reference transcriptome.
2.3. De Novo Assembly and Annotation
De novo transcriptome assembly using Trinity (v.3.0) was performed on the short RNA sequences to generate a reference transcriptome containing reference contigs. Contigs ≥ 500 bp were filtered and used for downstream analysis and annotation based on BLASTX against the non-redundant (nr) protein database from NCBI (http://blast.ncbi.nlm.nih.gov/), and the poplar and soybean (Glycine max) protein databases from Phytozome (v.10; https://phytozome.jgi.doe.gov/). Contigs with blast hits in any of the selected databases and E-values less than 10-3 were considered annotated. The longest putative coding sequences (ORFs) were predicted from contigs using the Trinity transdecoder utility at default parameters (except ‘stranded’ parameter). ORFs with the highest scores were selected using the Markov model (log likelihood ratio based on coding/non coding) in each of the six reading frames possible. Predicted ORFs were searched against the Pfam database to also obtain predicted peptides for contigs. Full-length transcripts were identified using BLASTX against the Swissprot database. Transcripts with greater than 80 percent alignment coverage to Swissprot hits were retained as full length.
2.4. Read Quality and Mapping
FastQC (v.0.11.2) and the FASTX toolkit (v.0.013.2) were used to assess the quality of each sample sequence and to execute quality trimming. Bases with Pfred33 scores below 30 were removed. Reads with greater than 50 bases (99% of total reads) were kept for further downstream analysis. Bowtie2 (v.2.2.6) was used to map quality trimmed reads against the de novo assembled transcriptome for koa using default parameters.
2.5. Transcript Abundance and Differential Expression
The RSEM tool within Trinity was used to estimate transcript abundance. Transcript length, number of reads mapped to transcript, and total number of reads were taken into account. The RSEM-EBSeq tool was employed to find differentially expressed (DE) contigs between two groups (HiFig vs LoFig, HiFig vs NoFig, LoFig vs NoFig) and across multiple groups (HiFig, LoFig, NoFig) at PPDE ≥ 0.95 (FDR ≤ 0.05). Specific expression patterns (Patterns 2 and 4) were identified and selected from expression across all three groups using RSEM-EBSeq (Table 1). When multiple DE contigs were annotated to same soybean protein the average of logFC values were used for pathway characterization and EBSeq pattern assignments. Expected counts generated from RSEM-EBSeq were used as input for DESeq2 (v.1.8.1). In DESeq2, distribution counts for the two experimental conditions were tested to identify DE genes with p-values and adjusted p-values of false discovery rate (FDR) to correct for multiple tests by DESeq2.
2.6. Pathway Analysis of DEGs
Contigs annotated using BLAST were then allocated to four pathways of interest; Phenylpropanoid, Lignin Biosynthesis, Jasmonic acid Biosynthesis, or Sucrose-Starch synthesis using MapMan (v.3.6.0). MapMan (Mercator pipeline) was used to generate pathway ‘bins’ and preliminary figures using soybean protein sequences as no annotation is available for koa genes. Information regarding the roles of the annotated genes was obtained from NCBI (http://www.ncbi.nlm.nih.gov/gene) and manuscripts published in Web of Science (http://apps.webofknowledge.com/). Heatmaps of these annotated genes were also generated for ‘Pattern 2’ and ‘Pattern 4’ genes using HeatmapGenerator5_MacOSX (https://sourceforge.net/projects/heatmapgenerator/).
3. Results
3.1. Analysis of Mapped Read Quality
Freshly sawn
cookies from five HiFig, four LoFig, and five NoFig individuals of the tetraploid
tree species koa were subjected to RNASeq analysis. Each HiFig sample averaged
approximately 31.87 million 100 bp reads with numbers for LoFig and NoFig koa
samples averaging 31.85 million and 27.13 million reads. All samples had about
98-99% of reads passing quality control with an average mapping rate of about
61% (Table 2).
3.2. Contigs and Alignments
A total of 683,388
contigs ≥ 500 bp were generated by Trinity for downstream analysis. The longest
contig assembled was 20,448 bp. There were 33 contigs greater than 10,000 bp
and 1,636 greater than 5,000 bp. Predicted protein and mRNA sequences were
obtained for 119,932 of 683,388 contigs (Table 3).
Contigs with greater than 80% alignment in the Swissprot database were
retained, resulting in 14,154 contigs. There were 292,418 contigs with hits to
the nr database representing 47.8% of contigs with database hits. Additionally,
275,009 (40.2%) had hits to the soybean protein database, 254,937 (37.3%) had
hits to the poplar database, and 244,208 (35.7%) had hits to all 3 databases.
Further narrowing of these contigs by pattern identification resulted in 20,380 transcripts that were greater than 90% identical to a gene within the database. Increasing stringency yielded 6,664 unique transcripts greater than 95% identical and 1,050 transcripts with 100% identity (Table 4). When evaluating the soybean database exclusively there were 1,116 100% identical matches and 1,481 95% identical matches to individual gene transcripts
3.3. Gene Expression Profiles
Total mapped reads
for all transcripts were used in analysis of the variation in gene expression
between HiFig, LoFig, and NoFig samples. A total of 290 genes were either up or
downregulated between HiFig and LoFig samples and only 176 genes between HiFig and
NoFig using DESeq2. Analysis with RSEM-EBSeq indicated 6,057 genes DE between
HiFig and LoFig compared to 906 genes for HiFig and NoFig. An overlap of 174
genes were identified from HiFig versus LoFig genes and 127 genes from HiFig
versus NoFig using both RSEM-EBSeq and DESeq2 (Figure 1).
Of the 290 genes identified using DESeq2, 213 were downregulated and 21 were
upregulated for HiFig to LoFig compared to upregulation of 383 genes and
downregulation of 967 genes from the 6,057 DE genes identified. The HiFig to
NoFig comparison resulted in 176 DE genes with upregulation of only 2 genes and
the downregulation of 51 genes using DESeq2. Use of RSEM-EBSeq resulted in 906
DE genes with 16 genes upregulated and 359 genes downregulated. There were no
DE genes identified using DESeq2 for the LoFig to NoFig comparison. However,
288 DE genes were isolated using RSEM-EBSeq. There were 47 upregulated genes
and 32 downregulated genes identified (Table 5). Use of both DESeq2 and RSEM-EBSeq
methods generated consistent results
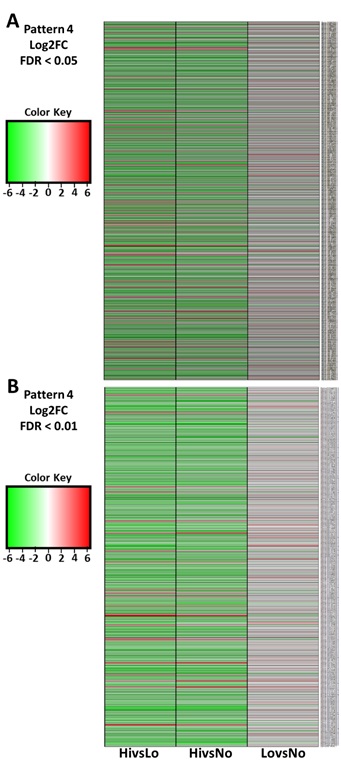
One of the primary objectives of this study was to compare genes expressed in koa trees with and without figure. A total of 1,663 genes were revealed that exhibited EBSeq Pattern 4. Where HiFig was significantly different from both LoFig and NoFig at FDR < 0.05 and, at FDR < 0.01, the number was reduced to 958 candidate genes for evaluation. Genes were further filtered at log2FC of +/- 2 in at least one pairwise comparison, hence numbers were reduced to 341 and 221 genes from 1,663 and 958 genes (Figure 2A, Figure 2B).
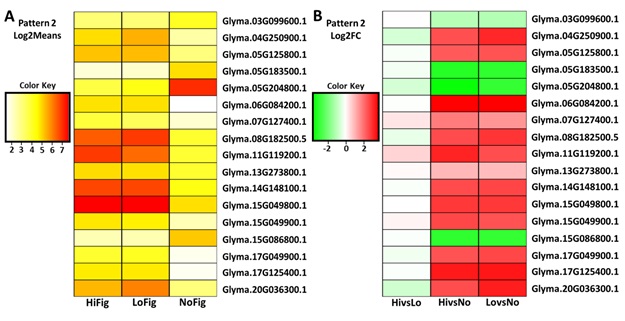
We evaluated the
number of genes that exhibited Pattern 2, when HiFig and LoFig significantly
differed from NoFig. Seventeen genes were isolated using Log2Means (Figure 3A). After
incorporation of Log2FC FDR < 0.1, 17 of these genes remained for further
study (Figure 3B). Of these genes, four were
unknown genes (Glyma.05G183500.1, Glyma.05G204800.1, Glyma.06G84200.1,
Glyma.15G049900.1), three uncharacterized loci LOC100786119,
LOC100306585, LOC100795405 (Glyma.03G099600.1, Glyma.11G119200.1,
Glyma.15G086800.1), three WAT1-related proteins (2- At1g68170-like, 1-
At4g08290-like) (Glyma.08G182500.5, Glyma.14G148100.1, Glyma.15G049800.1), an
auxin-induced protein 5NG4-like (Glyma.04G250900.1), a tetrahydrocannabinolic
acid synthase-like (Glyma.05G125800.1), a pentatricopeptide repeat-containing
protein At3g14330-like (Glyma.07G127400.1), a PRA1 family protein H
(Glyma.13G273800.1), a 12-oxophytodienoate reductase 3-like (Glyma.17G049900.1),
a cytochrome P450 71A1-like (Glyma.17G125400.1), and a single vacuolar amino
acid transporter 1-like (Glyma.20G036300.1).
3.4. Biosynthesis Pathway Analysis
In addition to genes described exhibiting the above patterns, the differentially expressed genes from four pathways involved in processes typically associated with wood formation were examined. DE genes involved in the phenylpropanoid (PP), jasmonic acid (JA), lignin biosynthesis (LB) and the sucrose – starch biosynthesis (SS) pathways were identified.
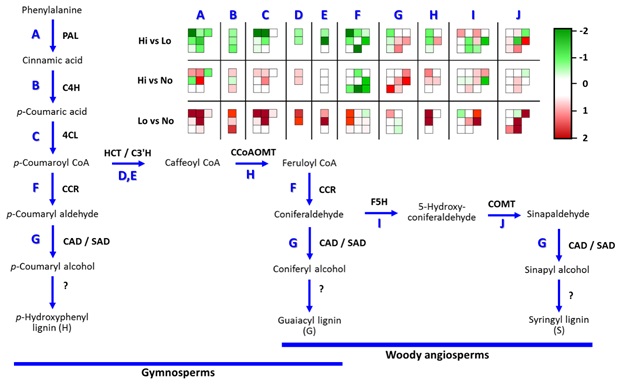
3.5. Phenylpropanoid Pathway Analysis
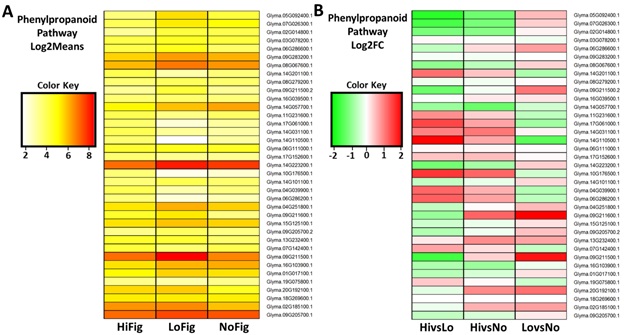
Genes that were DE
to a significant degree within the PP pathway were visualized in two formats,
Log2Means (Figure 4A) and Log2FoldChange (Figure 4B). This
close examination of the PP resulted in the identification of 37 gene
transcripts. Several dramatically different expression patterns were displayed
among the three groups (HiFig, LoFig, and NoFig). Seven of the most pronounced
differences between figured and non-figured samples were observed in those
transcripts coding for trans-resveratrol di-O-methyl transferase-like
(Glyma.06G286200.1, Glyma.14G201100.1), isoflavone reductase homolog
(Glyma.09G211500.2), spermidine hydroxycinnamoyl transferase-like
(Glyma.17G061000.1), omega-hydroxypalmitate O-feruloyl transferase-like
(Glyma.14G110500.1), isoflavone-7-O-methyltransferase 9-like
(Glyma.10G176500.1), and an uncharacterized acetyltransferase At3g50280 gene
(Glyma.04G039900.1).
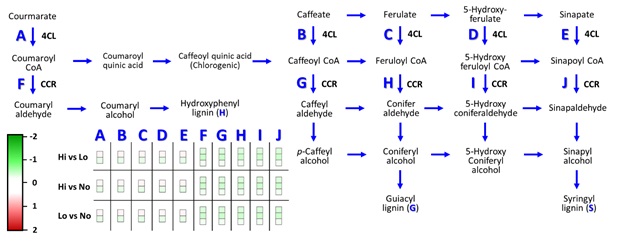
3.6. Lignin Biosynthesis Pathway Analysis
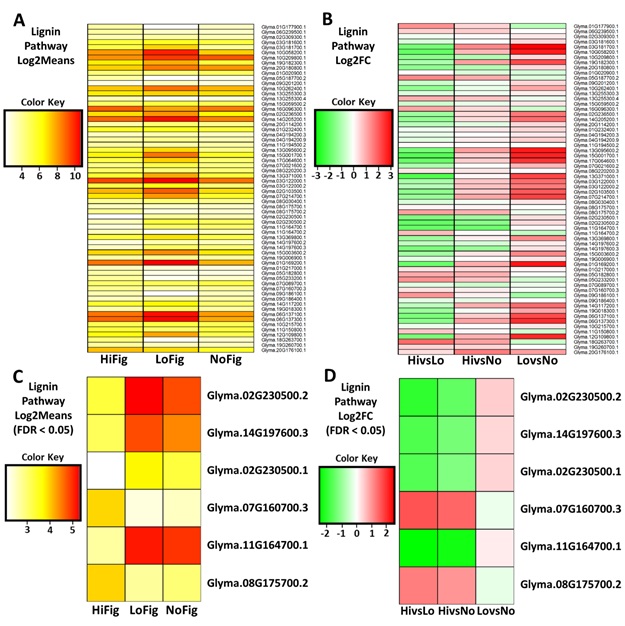
There were
numerous differentially expressed gene transcripts within the LB pathway. In
addition to visualization of the Log2Means (Figure 5A) and Log2FoldChange (Figure 5B), an additional stringency was applied. Use of FDR < 0.05
minimized the list of highly significant DE genes from 64 to the six most DE
genes. The highlighted transcripts corresponded to four cinnamoyl-CoA reductase
1 genes (Glyma.02G230500.2, Glyma.14G197600.3, Glyma.02G230500.1, and
Glyma.11G164700.1), a cytochrome P450 71D11-like gene (Glyma.07G160700.3), and
a single O-methyltransferase MdmC-like gene (Glyma.08G175700.2) (Figure 5C,
Figure 5D).
3.7. Jasmonic Acid Biosynthesis Pathway Analysis
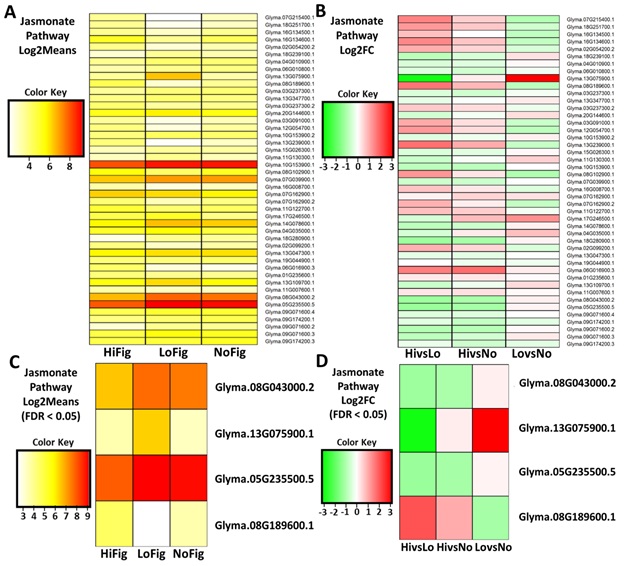
Analysis of the DE
levels for genes assigned to the JA pathway revealed 45 gene transcripts of
interest. These 45 transcripts were revealed after calculation of the Log2Means
(Figure 6A) and Log2FoldChange (Figure 6B), however, only four transcripts remained
after increasing the stringency to included FDR < 0.05. These four
transcripts coded for TIFY 6A-like (Glyma.05G235500.5), TIFY 6B-like
(Glyma.08G043000.2), linoleate 13S-lipoxygenase 2-1, chloroplastic-like
(Glyma.13G075900.1), and lipoxygenase-10 (Glyma.08G189600.1) (Figure 6C, Figure 6D).
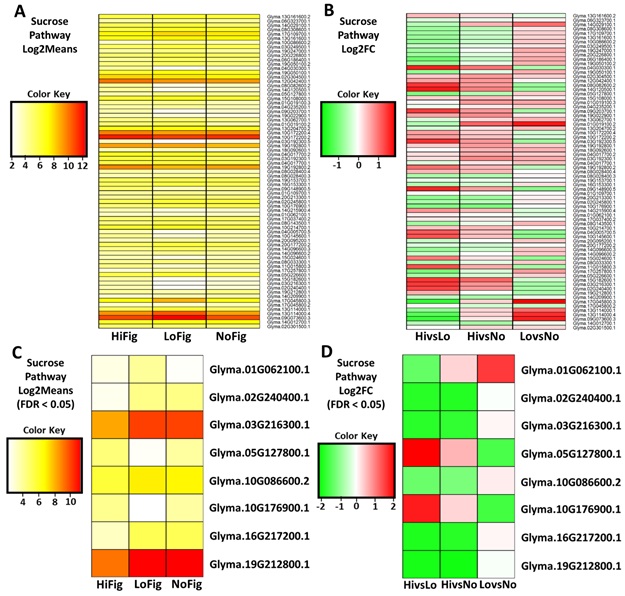
3.8. Sucrose – Starch Synthesis Pathway Analysis
Examination of the
DE genes in the SS pathway revealed the largest number of DE genes. There were
73 DE genes of interest identified in the sucrose-starch synthesis pathway
after Log2Means (Figure 7a) and Log2FoldChange (Figure 7B) were applied to the raw data. The
stringency was increased using FDR < 0.05 and 65 genes were eliminated. The
remaining eight genes coded for two sucrose synthase 7-like genes
(Glyma.02G240400.1, Glyma.16G217200.1), two sucrose synthase 2 genes (Glyma.03G216300.1,
Glyma.19G212800.1), a probable starch synthase 4, chloroplastic/amyloplastic
gene (Glyma.05G127800.1), a sucrose-phosphatase 1 gene (Glyma.10G086600.2), a
fructokinase-like 2 (Glyma.01G062100.1), a single probable fructokinase-5 gene
(Glyma.10G176900.1) (Figure 7C, Figure 7D).
An average of 25 DE gene transcripts corresponded to the PP pathway, an average of 83 to LB, 32 to JA, and an average of 73 to SS were observed when comparisons of HiFig vs LoFig, HiFig vs NoFig, and LoFig vs NoFig were visualized using MAPMAN. Visualization of the PP (Figure 8), the LB (Figure 9), the JA (Figure 10), and the SS (Figure 11) pathways were indicative of where the numerous DE genes were located. All DE genes presented in this work were summarized and placed into a table (Table 5). Heatmaps were recorded and compared to the NCBI databases for further gene identification (Table S1) and MAPMAN pathway genes that indicated differential expression were identified and presented (Table S2).
4. Discussion
There exists within this data a surfeit amount of evidence suggesting a genetic basis for figure however lack of available genotyping data for the harvested trees negates our ability to rule out any familial interactions. Nevertheless, these results represent the first comprehensive analysis of the presence or absence of figure in koa and the first transcriptomic-based analysis for figure in any tree species. Although results from this study do not exclude the possibility of additional environmental interactions, application of this cutting-edge approach to solve an age-old problem represents the first step towards eliminating the mystery of figure formation.
For numerous genes differentially expressed in the HiFig to Lo- and NoFig samples (Pattern 4) however, some of the most distinct ones were only captured using the in-depth pathway analysis conducted. As the examination of the nearly nine thousand genes that displayed Pattern 4 was beyond the scope of this study, only a subset of those genes relevant to Pattern 2 (HiFig and LoFig to NoFig) or a selection of biosynthesis pathways involved in wood formation were further studied.
Examination of Pattern 2 DE genes indicated that the WAT1 (Walls Are Thin1) gene and the 5NG4 gene are both significantly upregulated in figured individuals. The WAT1 gene is implicated in secondary cell wall formation and wood fiber thickness and is also involved in auxin transport and homeostasis [22,23]. Several isoforms of this gene were observed to be significantly DE and all showed the same pattern of expression when compared to NoFig individuals. Expression of the 5NG4 gene was significantly greater in HiFig, then LoFig, and finally NoFig individuals. As with WAT1, this gene also functions in auxin biosynthesis as demonstrated by Busov et al. [24] with loblolly pine (Pinus taeda L.). The 5NG4 gene was shown to be highly conserved in other model species and was involved in auxin induced adventitious root formation [24]. Also, downregulation of WAT1 led to cell elongation defects and significantly decreased cell wall fiber counts [23,25]. Thus, two of the primary genes isolated within the Pattern 2 cohort also play roles in hormone biosynthesis in other species.
Many genes that stand out in terms of DE within the 4 biosynthesis pathways chosen for further study. In the PP pathway, the isoflavone reductase (IFR) family was the most represented during the analyses. These genes are produced most often in leguminous species and have numerous functions from disease resistance [26,27] and secondary metabolism [28-30] to formation of root nodules [31]. Recent reports indicated that IFR can influence biosynthesis of lignin as well [32].
Examination of the LB pathway indicated that cinnamoyl-CoA reductase (CCR), the first enzyme in the lignin biosynthesis pathway, displayed significantly lower levels of expression in HiFig individuals when compared to LoFig and NoFig. Similar to results from work done by Yong et al. [33], we found many known pathway genes to be differentially expressed between the figured groups. Worthy of note is that our data revealed several CCR gene homologs within each tree. Previous studies have shown that CCR homologs are likely responsible for the variety in CCR functional abilities [34,35]. CCR genes have diverse roles in plant growth and development [36,37] ranging from drought stress responses [34,35] to lignification [38]. Multiple studies have noted that downregulation of CCR led to decreased overall lignin content [35,39]. Here, we noted significantly decreased levels of CCR in highly figured compared to non-figured koa.
Lipoxygenases (LOXs) represent initial enzymes activated during jasmonic acid synthesis and are involved in the plant response to abiotic stress conditions [40,41]. Typically induced during wounding [41,42], these genes may also have additional functions in plants [43]. Thus, the LOX genes identified in this analysis of koa may have been induced in response to felling, the cold treatment, or may be serving additional, uncharacterized, roles in figure formation. In addition, as noted by the significant expression differences in LOX, it is possible that several of the DE abiotic stress genes responsible for cold tolerance regulation were triggered by our preservation treatments to ensure RNA stability. Differentiation between genes exhibiting abiotic stress responses and those lox genes playing a role in figure formation is difficult. However, as many other expression changes were observed in highly figured samples, there existed no shortage of supportive evidence that presence of the various expression changes was not an artifact of extraction conditions. The direct role of any one transcript in generation of figure is not yet understood however, we note WAT1 and 5NG4 as candidates for future, more directed studies of the figured wood phenomenon.
The combination of DE patterns witnessed in these specific genes along with the pathways affected leads one to believe that such expression changes may be associated with the formation of figure. At the very least, the unique patterns of expression that differentiate figured koa from non-figured koa have been identified. Use of files included in the supplemental information will allow interested parties to continue more in-depth research into additional DE pathway genes uncovered in this work that were not highlighted.
5. Conclusions
This study examined upregulation and downregulation of a selected subset of genes found to be significantly expressed in figured wood when compared to non-figured wood samples. Many of these genes are known to play numerous roles in plant growth and development but their functions in the formation of figured wood have yet to be identified. De novo assembly and RNAseq of the koa wood transcriptome were used to identify genes involved in development of figured wood. The objective of this study was to identify and examine transcripts differentially expressed to a significant level in HiFig, LoFig, and NoFig koa wood samples. Highlighted genes were then mapped to the phenylpropanoid, lignin biosynthesis, jasmonic acid biosynthesis, and sucrose – starch synthesis pathways. Numerous additional genes were differentially expressed but were not directly implicated in the pathways investigated here and thus, were not highlighted for further study at this time. These additional genes, however, may also play roles in the development of figured wood. Conversely, further investigations into the genes DE in this work but not highlighted in one of the four pathways pinpointed will likely implicate other uninvestigated pathways involved in the formation of figure in Acacia koa. The direct role of these transcripts in the generation of figure is not yet understood however, these data are the first to provide a starting point for future, more directed gene studies into the figured wood phenomenon.
6. Acknowledgements
The authors would like to thank Mr. Sagar Utturkar and Drs. Mark Coggeshall, Ratnam Wickneswari, and Melissa Wong for valuable and insightful feedback on the manuscript. We thank Drs. J.B. Friday and Faith Inman for providing the cookie samples. We acknowledge the State of Hawaii Department of Land and Natural Resources (DLNR) – Division of Forestry and Wildlife (DOFAW) and/or State Parks, as well as the USDA Forest Service (FS) as land managers and administrators for the Hawaii Experimental Tropical Forest. This project was funded by the USDA Forest Service and The Atherton Family Foundation.
7. Conflict of Interest Statement
The authors
declare that the research was conducted in the absence of any commercial or
financial relationships that could be construed as a potential conflict of
interest.
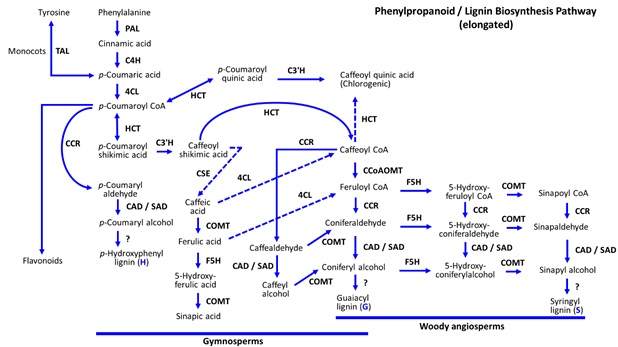
Figure S1: Rendering of more
complete Phenylpropanoid and Lignin Biosynthesis Pathways unlike the simplified
version depicted in the manuscript.
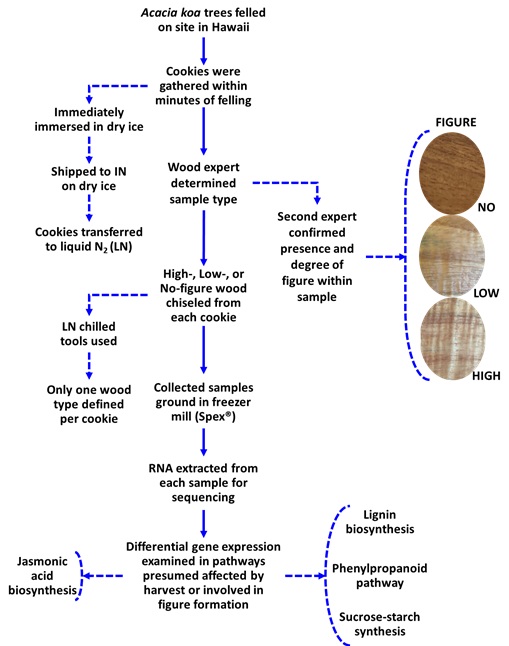
Figure
S2:
Experimental flow chart. Simplified version of experimental progression with
examples of non-figured, lightly-figured, and highly-figured wood designations.
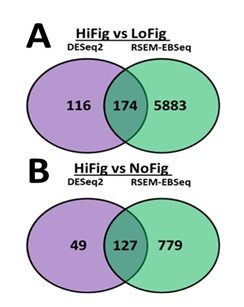
Figure 1: Venn diagrams. (a) Illustration of the number of genes
differentially expressed in HiFig versus LoFig and (b) HiFig versus NoFig individuals.
Figures
2(A-B):
Heatmaps of ‘Pattern 4’ gene expression. (A)
Pattern 4 genes isolated at a Log2FC and a FDR < 0.05 and (B) at FDR < 0.01. Upregulated
(green, -2). Downregulated (red, 2).
Figures
3(A-B):
Heatmaps of ‘Pattern 2’ gene expression. (A)
Pattern 2 genes isolated using Log2Means and (B) Log2FC. Upregulated (green, -2). Downregulated (red, 2).
Figures
4(A-B):
Heatmaps of Phenylpropanoid Pathway gene expression. (A) Phenylpropanoid Pathway genes isolated using Log2Means and (B) Log2FC. Upregulated (green, -2).
Downregulated (red, 2).
Figures
5(A-D):
Heatmaps of Lignin Biosynthesis Pathway gene expression. (A) Lignin Pathway genes isolated using Log2Means, (B) Log2FC, (C) Log2Means with a FDR < 0.05, and (D) Log2FC with a FDR < 0.05. (A,C) Lower (yellow, 3),
Higher (red, 10); (B,D) Upregulated (green, -2),
Downregulated (red, 2).
Figures
6(A-D):
Heatmaps of Jasmonate Biosynthesis Pathway gene expression. (A) Jasmonate Pathway genes isolated using Log2Means, (B) Log2FC, (C) Log2Means with a FDR < 0.05, and (D) Log2FC with a FDR < 0.05. (A,C) Lower (yellow, 3),
Higher (red, 9); (B,D) Upregulated (green, -2),
Downregulated (red, 2).
Figure
8:
Depiction of Phenylpropanoid Pathway gene expression using MapMan. Upregulated
(green, -2). Downregulated (red, 2).
Figure
9:
Depiction of Lignin Biosynthesis Pathway gene expression using MapMan. Upregulated
(green, -2). Downregulated (red, 2).
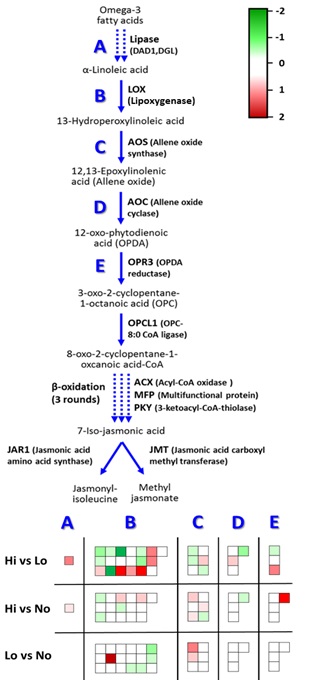
Figure
10: Depiction
of Jasmonate Biosynthesis Pathway gene expression using MapMan. Upregulated
(green, -2). Downregulated (red, 2).
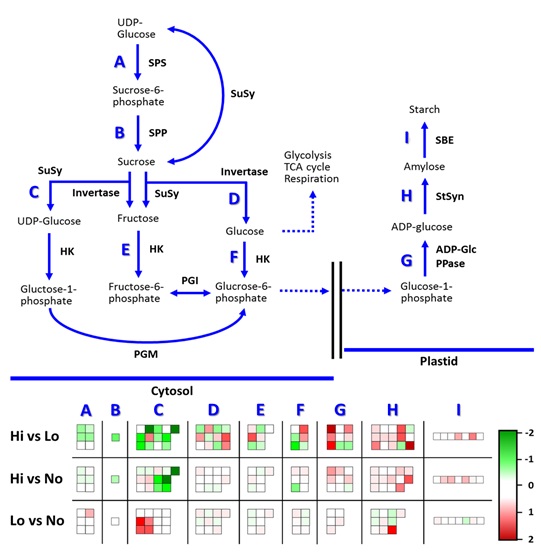
Figure
11:
Depiction of Sucrose-Starch Biosynthesis Pathway gene expression using MapMan.
Upregulated (green, -2). Downregulated (red, 2).
|
Pattern |
HiFig |
LoFig |
NoFig |
Transcripts |
|
1 |
A |
A |
A |
67,934 |
|
2 |
A |
A |
B |
34 |
|
3 |
A |
B |
A |
6,775 |
|
4 |
A |
B |
B |
8,785 |
|
5 |
A |
B |
C |
3 |
Table 1: Pattern identification. Significant differences in transcript gene expression across comparative samples.
|
|
Ttl. Reads (Avg) |
Quality Reads (Avg) |
% Passing QC (Avg) |
Total Mapped (Pairwise Avg) |
Mapping Rate (Avg) |
|
HiFig |
31,873,475 |
31,670,910 |
99.37 |
38,999,838 |
61.98 |
|
LoFig |
31,853,051 |
31,609,266 |
99.24 |
37,801,811 |
60.45 |
|
NoFig |
27,127,237 |
26,932,403 |
99.28 |
32,778,058 |
60.82 |
|
Overall Avg |
30,284,588 |
30,070,860 |
99.30 |
36,526,569 |
61.08 |
Table 2: Mapping statistics. Number of reads mapping back to the de novo koa transcriptome.
|
Category |
Large Contigs |
All Contigs |
|
Min. contig size |
500 |
n/a |
|
No. of contigs |
683,388 |
2,019,460 |
|
No. of bases |
730,029,444 |
1,131,682,574 |
|
Contig size range |
500 – 20,488 |
0 – 20,488 |
|
N50 |
1,171 |
729 |
|
# sequences at N50+ |
189,650 |
n/a |
|
Average length |
1,068 |
560 |
Table 3: Contig data. Breakdown of contig information from transcriptome analysis.
|
|
HiFig vs LoFig |
HiFig vs NoFig |
LoFig vs NoFig |
|
|
DESeq2[LSS-1] |
||||
|
p-value |
p < 0.05 |
38,763 |
19,739 |
21,060 |
|
p < 0.01 |
9,105 |
3,987 |
4,246 |
|
|
p < 0.001 |
1,306 |
704 |
496 |
|
|
p-value (Adj) |
p < 0.05 |
290 |
176 |
0 |
|
p < 0.01 |
48 |
76 |
0 |
|
|
p < 0.001 |
4 |
29 |
0 |
|
|
RSEM-EBSeq[LSS-2] |
||||
|
|
FDR < 0.05 |
6,057 |
906 |
288 |
Table 4: Stringency counts. Unique differentially expressed transcripts identified by both DESeq2 and RSEM-EBSeq methods.
|
Name |
Locus ID |
Change in Expression (log2FC) |
Change in Expression (Mean) |
||||
|
Hi vs Lo |
Hi vs No |
Lo vs No |
HiFig |
LoFig |
NoFig |
||
|
Pattern 2[LSS-1] |
|||||||
|
Uncharacterized |
Glyma.03G099600.1 |
0.029153127 |
-1.01428975 |
-1.043442877 |
3.282475356 |
3.253322229 |
4.296765106 |
|
5NG4 |
Glyma.04G250900.1 |
-0.580251734 |
2.430746071 |
3.010997805 |
5.124257831 |
5.704509565 |
2.69351176 |
|
Unknown |
Glyma.05G125800.1 |
-0.102524937 |
2.283929111 |
2.386454048 |
5.45626926 |
5.558794197 |
3.172340149 |
|
Unknown |
Glyma.05G183500.1 |
-0.134967819 |
-3.035027064 |
-2.900059245 |
2.065220018 |
2.200187837 |
5.100247082 |
|
P21 |
Glyma.05G204800.1 |
-0.590941495 |
-3.443346778 |
-2.852405283 |
3.901037988 |
4.491702718 |
7.340506732 |
|
Unknown |
Glyma.06G084200.1 |
-0.034364364 |
3.538202697 |
3.572567061 |
5.063288402 |
5.09192193 |
1.550856192 |
|
TPR |
Glyma.07G127400.1 |
0.363261743 |
1.813331501 |
1.450069758 |
3.978316456 |
3.615054713 |
2.164984955 |
|
WAT1 |
Glyma.08G182500.5 |
-0.303444199 |
2.505224963 |
2.808669163 |
6.728099369 |
7.152873516 |
4.134732222 |
|
Uncharacterized |
Glyma.11G119200.1 |
0.600719236 |
3.065765126 |
2.46504589 |
7.15462924 |
6.553910005 |
4.088864114 |
|
PRA1.H |
Glyma.13G273800.1 |
0.078768676 |
1.005390031 |
0.926621355 |
5.15614126 |
5.077372584 |
4.150751229 |
|
WAT1 |
Glyma.14G148100.1 |
-0.063761829 |
2.520716332 |
2.584478162 |
7.018743897 |
7.01936246 |
4.501619795 |
|
WAT1 |
Glyma.15G049800.1 |
0.00784575 |
2.782509056 |
2.774663306 |
7.892388845 |
7.884543096 |
5.10987979 |
|
Unknown |
Glyma.15G049900.1 |
0.136527351 |
2.548701126 |
2.412173775 |
5.019293847 |
4.882766497 |
2.470592721 |
|
Uncharacterized |
Glyma.15G086800.1 |
-0.038691016 |
-2.880348615 |
-2.841657599 |
2.489596554 |
2.538918075 |
5.389394159 |
|
PM ATPase |
Glyma.17G061800.1 |
-0.18393989 |
2.379815477 |
2.563755367 |
4.144699213 |
4.328639103 |
1.764883736 |
|
CYP71A20 |
Glyma.17G125400.1 |
-0.040455609 |
3.202722739 |
3.243178347 |
4.925354917 |
4.965810526 |
1.722632178 |
|
AAT1 |
Glyma.20G036300.1 |
-0.668306739 |
2.48159134 |
3.149898079 |
5.622676675 |
6.279759431 |
3.185096086 |
|
|
|||||||
|
Phenylpropanoid Pathway[LSS-2] |
|||||||
|
DFR |
Glyma.01G017100.1 |
-0.554556369 |
-0.331751422 |
0.222804947 |
5.277401253 |
5.831957622 |
5.609152675 |
|
KYAT1 |
Glyma.02G014800.1 |
-1.070486705 |
-0.977536349 |
0.092950356 |
3.137339713 |
4.380360268 |
4.178584552 |
|
HCBT1 |
Glyma.02G185100.1 |
-0.14945244 |
0.622464299 |
0.771916739 |
6.687943081 |
6.83739552 |
6.065478782 |
|
BAHDAT |
Glyma.03G078200.1 |
0.061025626 |
-0.042615279 |
-0.103640906 |
4.258307245 |
4.782364645 |
4.426520317 |
|
Uncharacterized |
Glyma.04G039900.1 |
1.220710968 |
0.619920765 |
-0.600790203 |
4.10377592 |
2.883064952 |
3.483855155 |
|
Uncharacterized |
Glyma.04G251800.1 |
-0.498951462 |
0.044518866 |
0.543470328 |
5.556812161 |
6.316276236 |
5.858873811 |
|
Uncharacterized |
Glyma.05G092400.1 |
-1.713909586 |
-1.169501097 |
0.544408489 |
3.54091632 |
5.675296836 |
4.40584563 |
|
MAT |
Glyma.06G111000.1 |
0.059076343 |
0.074298674 |
0.01522233 |
4.551480462 |
4.844223442 |
4.771453283 |
|
ROMT |
Glyma.06G286200.1 |
1.268291811 |
0.74280333 |
-0.525488481 |
3.538081466 |
2.269789655 |
2.795278136 |
|
ROMT |
Glyma.06G286600.1 |
-0.491558224 |
0.276378627 |
0.767936851 |
4.211718861 |
4.894329211 |
3.828839579 |
|
CCR |
Glyma.07G026300.1 |
-1.471433739 |
-1.0834021 |
0.388031639 |
4.010873308 |
5.450621542 |
5.17902804 |
|
LAC7 |
Glyma.07G142400.1 |
0.724317198 |
0.259958557 |
-0.464358641 |
4.430691626 |
3.706374428 |
4.170733069 |
|
NIC1 |
Glyma.08G067600.1 |
-0.902155894 |
-0.548553141 |
0.353602753 |
6.209349132 |
7.097117198 |
6.696229146 |
|
NIC1 |
Glyma.08G279200.1 |
-0.138599873 |
-0.109645245 |
0.028954628 |
3.669145315 |
3.979009647 |
3.749940452 |
|
CCR2 |
Glyma.09G205700.1 |
-0.488689767 |
-0.327239478 |
0.161450288 |
7.272006287 |
7.760696053 |
7.599245765 |
|
TKPR2 |
Glyma.09G205700.2 |
-0.615374676 |
-0.126309767 |
0.489064909 |
3.330611496 |
3.945986173 |
3.456921263 |
|
IFR |
Glyma.09G211500.1 |
-1.525926321 |
0.354925038 |
1.880851359 |
7.234641281 |
8.761355087 |
6.914093645 |
|
IFR |
Glyma.09G211500.2 |
-1.175825107 |
-0.078727932 |
1.097097175 |
3.175213766 |
4.431092366 |
3.15359057 |
|
IFR |
Glyma.09G211600.1 |
-0.816334601 |
1.229841359 |
2.04617596 |
4.63449792 |
5.49707164 |
3.409942716 |
|
NUC2 |
Glyma.09G283200.1 |
-0.073624437 |
-0.092418186 |
-0.018793749 |
5.829242046 |
6.581952776 |
6.290567127 |
|
IF7OMT6 |
Glyma.10G176500.1 |
1.605960717 |
1.223189502 |
-0.382771215 |
3.61424062 |
2.008279903 |
2.391051118 |
|
HHT1 |
Glyma.11G231600.1 |
0.88656568 |
0.369023717 |
-0.517541963 |
4.099125328 |
3.382199253 |
3.847652481 |
|
DBAT |
Glyma.13G232400.1 |
0.180454421 |
0.912080372 |
0.731625951 |
4.678626079 |
4.565320823 |
3.770771484 |
|
SHT |
Glyma.14G031100.1 |
1.00279276 |
1.080602754 |
0.077809994 |
4.064849447 |
3.139360126 |
2.964878279 |
|
HHT1 |
Glyma.14G057700.1 |
-0.802239727 |
-1.19158522 |
-0.389345493 |
5.285514715 |
6.085146245 |
6.475601066 |
|
FBT6 |
Glyma.14G101100.1 |
-0.480984551 |
-0.177980358 |
0.303004194 |
3.568025798 |
4.122801684 |
3.748982789 |
|
HHT1 |
Glyma.14G110500.1 |
2.01318471 |
0.701995808 |
-1.311188902 |
3.697826763 |
1.684642053 |
2.995830955 |
|
ROMT |
Glyma.14G201100.1 |
1.151162158 |
0.4777048 |
-0.673457358 |
4.140287452 |
2.921211517 |
3.588467612 |
|
OPCL1/4CL5L |
Glyma.14G223200.1 |
-1.118951831 |
-0.723824852 |
0.395126978 |
7.249021596 |
8.367973427 |
7.972846449 |
|
CCR2 |
Glyma.15G125100.1 |
-0.397390584 |
-0.159468017 |
0.237922568 |
5.596386354 |
6.061539355 |
5.830936623 |
|
SHT |
Glyma.16G039500.1 |
-0.047232864 |
0.16243061 |
0.209663474 |
3.653352149 |
3.746454717 |
3.573121797 |
|
IFR |
Glyma.16G103900.1 |
-0.648305851 |
-0.79036686 |
-0.142061009 |
5.60070908 |
6.249014931 |
6.39107594 |
|
SHT |
Glyma.17G061000.1 |
1.473796744 |
0.720800563 |
-0.752996181 |
3.762427017 |
2.288630273 |
3.041626454 |
|
Uncharacterized |
Glyma.17G152600.1 |
0.475941598 |
0.514022952 |
0.038081355 |
3.687847989 |
3.258946466 |
3.20054486 |
|
I4OMT |
Glyma.18G269600.1 |
-0.002759121 |
0.017232456 |
0.019991577 |
5.458080726 |
5.460839847 |
5.44084827 |
|
4CLL9 |
Glyma.19G075800.1 |
0.426845684 |
0.036316605 |
-0.390529079 |
3.334460323 |
2.907614638 |
3.298143717 |
|
OPCL1/4CL5L |
Glyma.20G192100.1 |
-0.213251796 |
0.930798286 |
1.144050082 |
5.734364615 |
5.930015139 |
4.808565734 |
|
|
|||||||
|
Lignin Biosynthesis[LSS-3] |
|||||||
|
CCR |
Glyma.02G230500.1 |
-1.650005195 |
-1.230768311 |
0.419236883 |
2.104359456 |
3.754364651 |
3.335127768 |
|
CCR |
Glyma.02G230500.2 |
-2.00219169 |
-1.520739697 |
0.481451994 |
3.344750462 |
5.346942153 |
4.865490159 |
|
CYP71B34 |
Glyma.07G160700.3 |
1.653091045 |
1.478292463 |
-0.174798581 |
3.979600701 |
2.326509656 |
2.501308238 |
|
SAM_DM |
Glyma.08G175700.2 |
1.247911041 |
1.010930226 |
-0.236980816 |
3.996820817 |
2.748909776 |
2.985890591 |
|
CCR |
Glyma.11G164700.1 |
-2.472865425 |
-2.295406885 |
0.177458539 |
2.718658475 |
5.191523899 |
5.01406536 |
|
CCR |
Glyma.14G197600.3 |
-1.705343706 |
-1.325317663 |
0.380026043 |
3.156719244 |
4.86206295 |
4.482036907 |
|
|
|||||||
|
Jasmonate Acid Biosynthesis[LSS-4] |
|||||||
|
TIFY-6A / JAI3 |
Glyma.05G235500.5 |
-1.241169211 |
-1.09612794 |
0.145041271 |
7.966635005 |
9.207804216 |
9.062762945 |
|
TIFY-6B / JAI3 |
Glyma.08G043000.2 |
-1.198420877 |
-1.018358769 |
0.180062108 |
6.581517398 |
7.779938274 |
7.599876167 |
|
LOX10 |
Glyma.08G189600.1 |
2.101127699 |
1.014404829 |
-1.086722869 |
4.551603324 |
2.450475626 |
3.537198495 |
|
LOX2.1 |
Glyma.13G075900.1 |
-2.916104731 |
0.217172031 |
3.133276762 |
3.52446249 |
6.440567221 |
3.307290459 |
|
|
|||||||
|
Sucrose – Starch Synthase Pathway[LSS-5] |
|||||||
|
FLN2 |
Glyma.01G062100.1 |
-1.361517101 |
0.375128036 |
1.736645137 |
2.589073676 |
3.950590777 |
2.21394564 |
|
Sus7 |
Glyma.02G240400.1 |
-1.90866193 |
-1.936607402 |
-0.027945471 |
2.429141288 |
4.248619805 |
4.283271047 |
|
Sus2 |
Glyma.03G216300.1 |
-1.895033332 |
-1.813223263 |
0.081810069 |
8.243479731 |
10.13851306 |
10.05670299 |
|
SS4 |
Glyma.05G127800.1 |
2.262340512 |
0.650877237 |
-1.611463275 |
4.514216413 |
2.259203138 |
3.834696415 |
|
SPP1 |
Glyma.10G086600.2 |
-1.313767296 |
-1.162566618 |
0.151200679 |
5.657000561 |
6.955435021 |
6.799120909 |
|
FK5 |
Glyma.10G176900.1 |
2.016634614 |
0.356189759 |
-1.660444855 |
4.109855506 |
2.093220893 |
3.753665747 |
|
Sus7 |
Glyma.16G217200.1 |
-1.986106956 |
-1.913530771 |
0.072576186 |
3.214596727 |
5.20094454 |
5.146691418 |
|
Sus2 |
Glyma.19G212800.1 |
-2.037807731 |
-2.096327112 |
-0.058519381 |
9.178517416 |
11.21632515 |
11.27484453 |
|
4CLL9, 4-coumarate-CoA ligase-like 9; 5NG4, Auxin-induced transmembrane protein similar to Walls Are Thin1; AAT1, Vacuolar amino acid transporter 1; BAHDAT, BAHD acyltransferase; CCR, Cinnamoyl-CoA reductase 1; CCR2, Cinnamoyl-CoA reductase 2; CYP71A20, Cytochrome P450 family 71-subfamily A polypeptide 20; CYP71B34 "Cytochrome P450 family 71-subfamily B polypeptide 34; DBAT, 10-deacetylbaccatin III 10-O-acetyltransferase; DFR, Dihydroflavonol-4-reductase; FBT6, Probable folate-biopterin transporter 6; FK5, Probable fructokinase-5; FLN2, Fructokinase-like 2; HCBT1, Anthranilate N-benzoyltransferase protein 1-like; HHT1, Omega-hydroxypalmitate O-feruloyl transferase; I4OMT, Isoflavone 4'-O-methyltransferase; IF7OMT6, Isoflavone-7-O-methyltransferase 6; IFR, Isoflavone reductase; JAI3 / TIFY-6A, Jasmonate-zim-domain protein 3; JAI3 / TIFY-6B, Jasmonate-zim-domain protein 3; KYAT1, Kynurenine--oxoglutarate transaminase 1; LAC7, Laccase 7; LOX10, Linoleate 9S-lipoxygenase 10; LOX2.1, Linoleate 13S-lipoxygenase 2-1, chloroplastic; MAT, Methionine aminotransferase; NIC1, Nicotinamidase 1-like; NIC2, Nicotinamidase 2-like; OPCL1 / 4CL5L, 3-oxo-2-(2'-[Z]-pentenyl)cyclopentane-1-octanoate CoA ligase / 4-coumarate--CoA ligase-like 5; P21, P21-like protein; PM ATPase, Plasma membrane ATPase;PRA1.H, PRA1 family protein H; ROMT, Trans-resveratrol di-O-methyltransferase; SAM_DM, S-adenosyl-L-methionine-dependent methyltransferases superfamily protein; SHT, Shikimate O-hydroxycinnamoyltransferase; SPP1, Sucrose-6F-phosphate phosphohydrolase family pnrotein; SS4, Starch synthase 4; Sus2, Sucrose synthase 2; Sus7, Sucrose synthase 7; TKPR2, Tetraketide alpha-pyrone reductase 2; TPR, Tetratricopeptide repeat (TPR)-like superfamily protein; WAT1, Walls Are Thin1.
|
|||||||
Table 5: Summary of genes highlighted in this study and their respective expression changes.